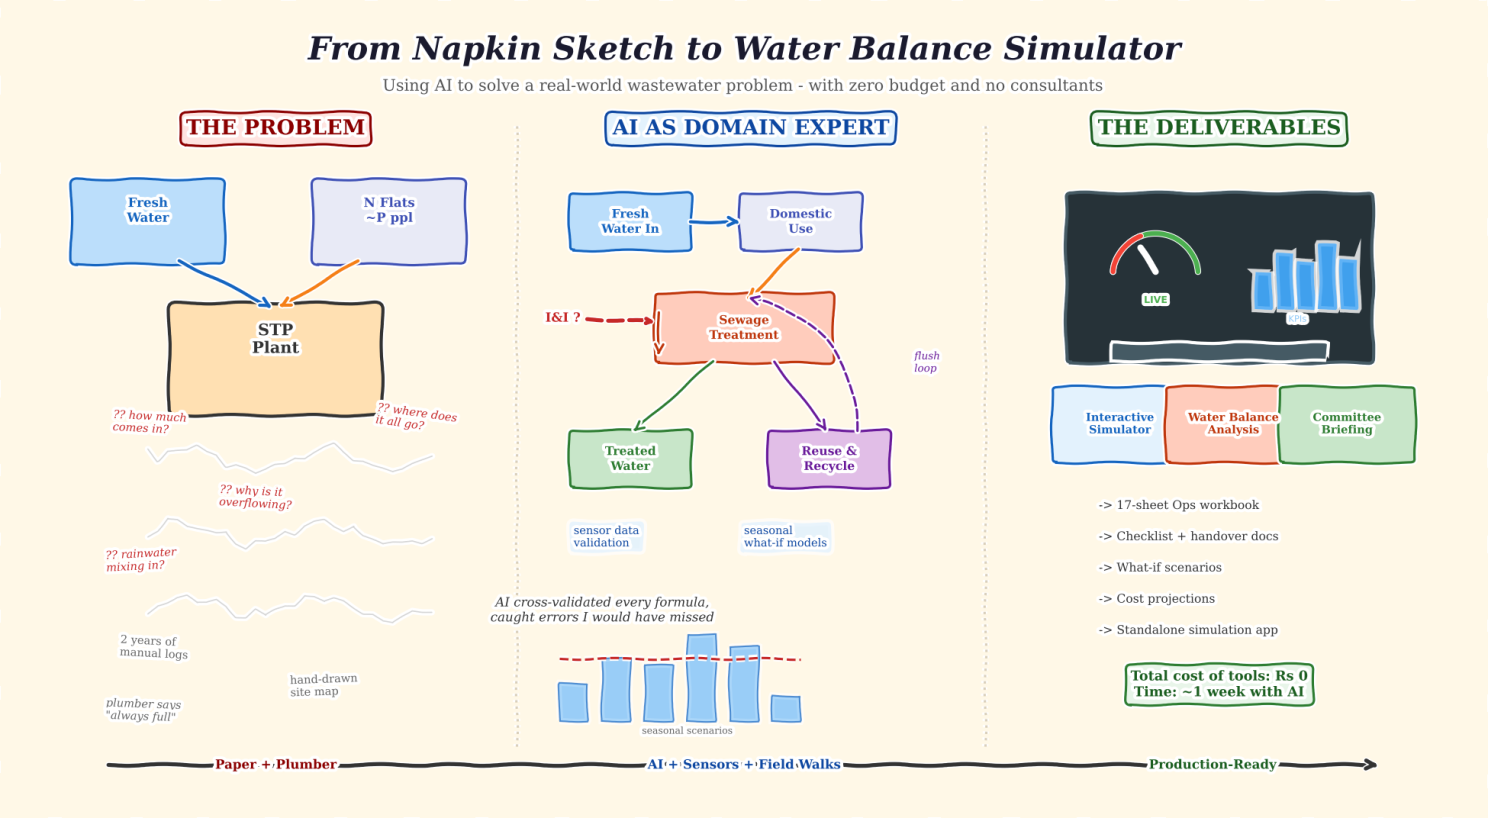
From Paper to production story of Human + AI – How I used LLMs as a domain soundboard, data validator, and simulation builder to manage my apartment’s sewage treatment plant!
The Setup
For the last two years, I have been voluntarily managing the sewage treatment plant of my residential apartment complex. Not because I am a wastewater engineer – “I am not” but because nobody else on the committee had the bandwidth (or so they told), and I had the curiosity to question things as I stayed closer to its vicinity . Also, managing STP was brutally hard, this space was notorious with frequent mails, shouting fixes and what not! So, in a way, this was also forced upon me. In hindsight, it was a blessing in disguise for me to learn something new and apply technology meaningfully.
What started as “just keep it running” slowly turned into something more complex. The plant was showing signs of overload during monsoons. The operator (humble plumber) said it was “always like this.” The trigger point was the helplessness of our plumber when he said, “There is so much water and you tell me what to do with it!”. The previous committee had limited documentation. The logs were inconsistent. The regulatory filings used assumptions that did not match what I was observing on the ground.
I had questions. How much water are we actually consuming? Where does it go after use? Why does the STP overflow seasonally? Is rainwater getting into the sewage line? Are we even compliant?
I had no budget to hire a consultant. What I had: two years of manually collected operational data, sensor readings from a couple of installed meters, hand-drawn site maps, commissioning documents from regulatory authorities, and field knowledge from our plumber who has been maintaining the system for years. Given my background (next segment), I had ensured that in my two year tenure, we approach this data driven, if manually collected. So, in 2 years, I had this body of work to assimilate Very Important
And I had access to something that did not exist two years ago – large language models that could reason across domains. In its absence I was a bit lost manually doing this number crunching and modeling.
My Background (and the Gap)
My day job involves enterprise platforms and Industrial IoT. I have spent years working with sensor data, systems architecture, data pipelines, and building solutions that connect operational technology with information technology. So the analytical side – collecting data, structuring it, building models, thinking in systems – came naturally to me.
What I lacked was the wastewater domain knowledge. I did not know the standard hydraulic retention times for an aeration tank. I could not tell you what MLSS levels indicate healthy biology. I had no reference for what percentage of domestic water typically becomes sewage in an Indian residential context.
I was genuinely curious: could an LLM fill that gap? Not replace an expert, but act as a domain soundboard – the way a knowledgeable colleague would if I were brainstorming at a whiteboard?
What I Did
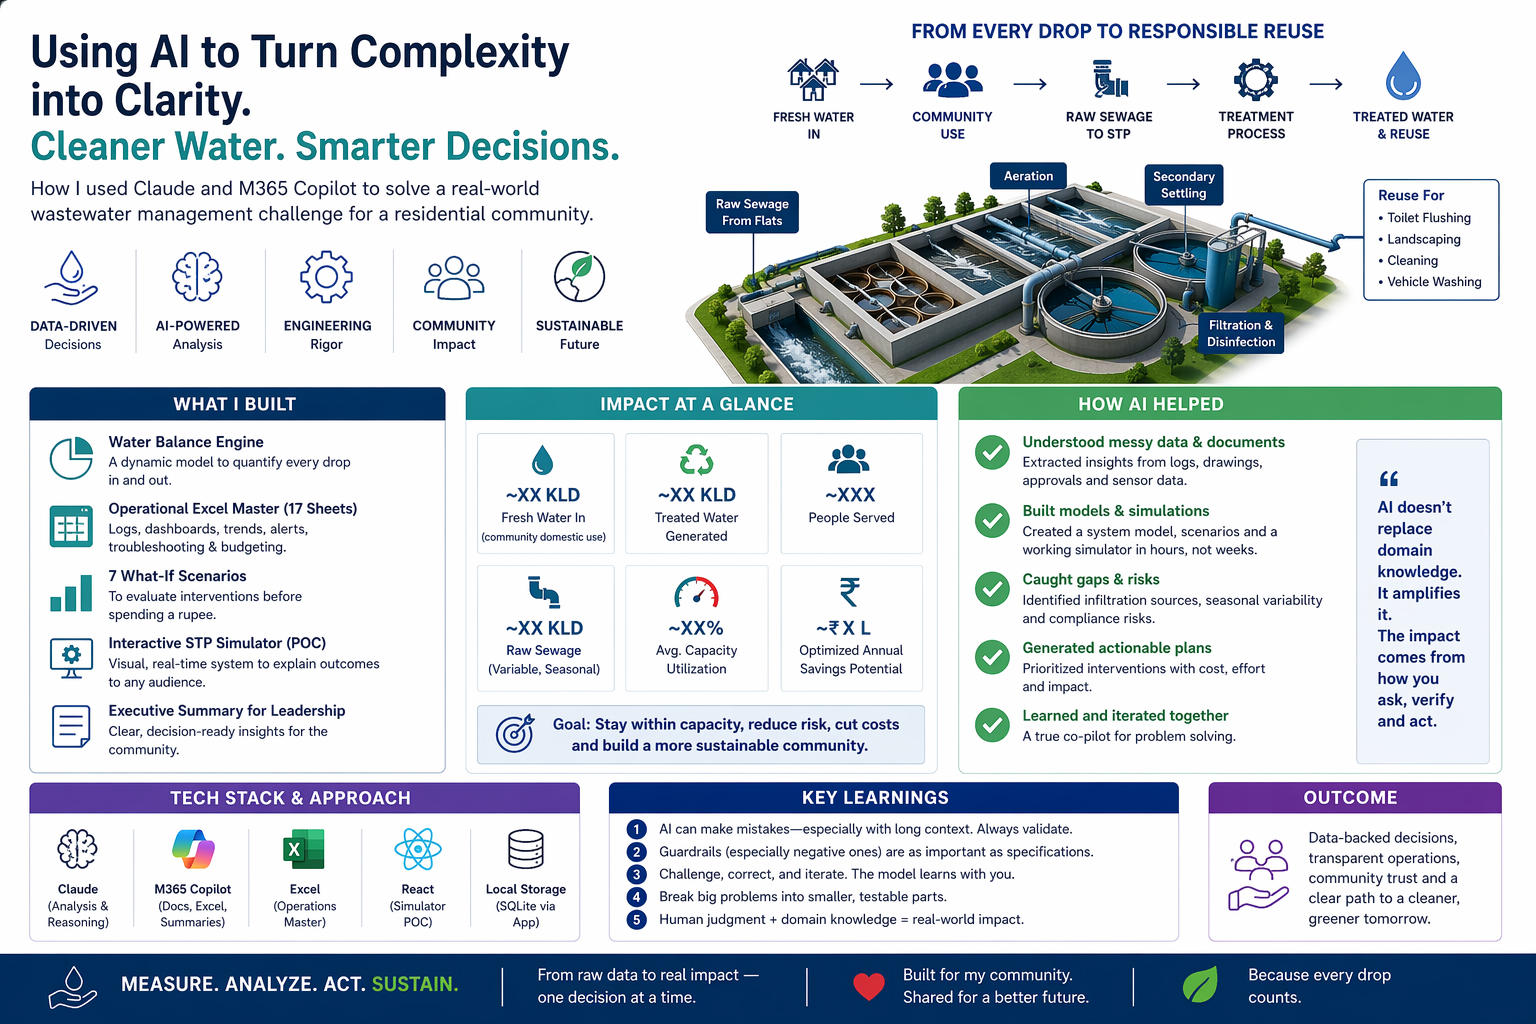
I spent roughly two weeks in deep collaboration with an LLM (primarily Claude, with some use of GPT for cross-validation and M365 Copilot for enterprise document workflows). Here is what that collaboration looked like:
Phase 1 – Data Collection and Structuring
I fed in two years of manual logs, sensor data exports, hand-drawn P&ID diagrams, regulatory documents, and field observations. The LLM helped me structure this into a normalized format – a 17-worksheet operational workbook covering asset inventories, maintenance schedules, daily logs, chemical dosing records, and process parameters.
This alone would have taken me weeks manually. With the LLM, it took about two days of iterative back-and-forth.
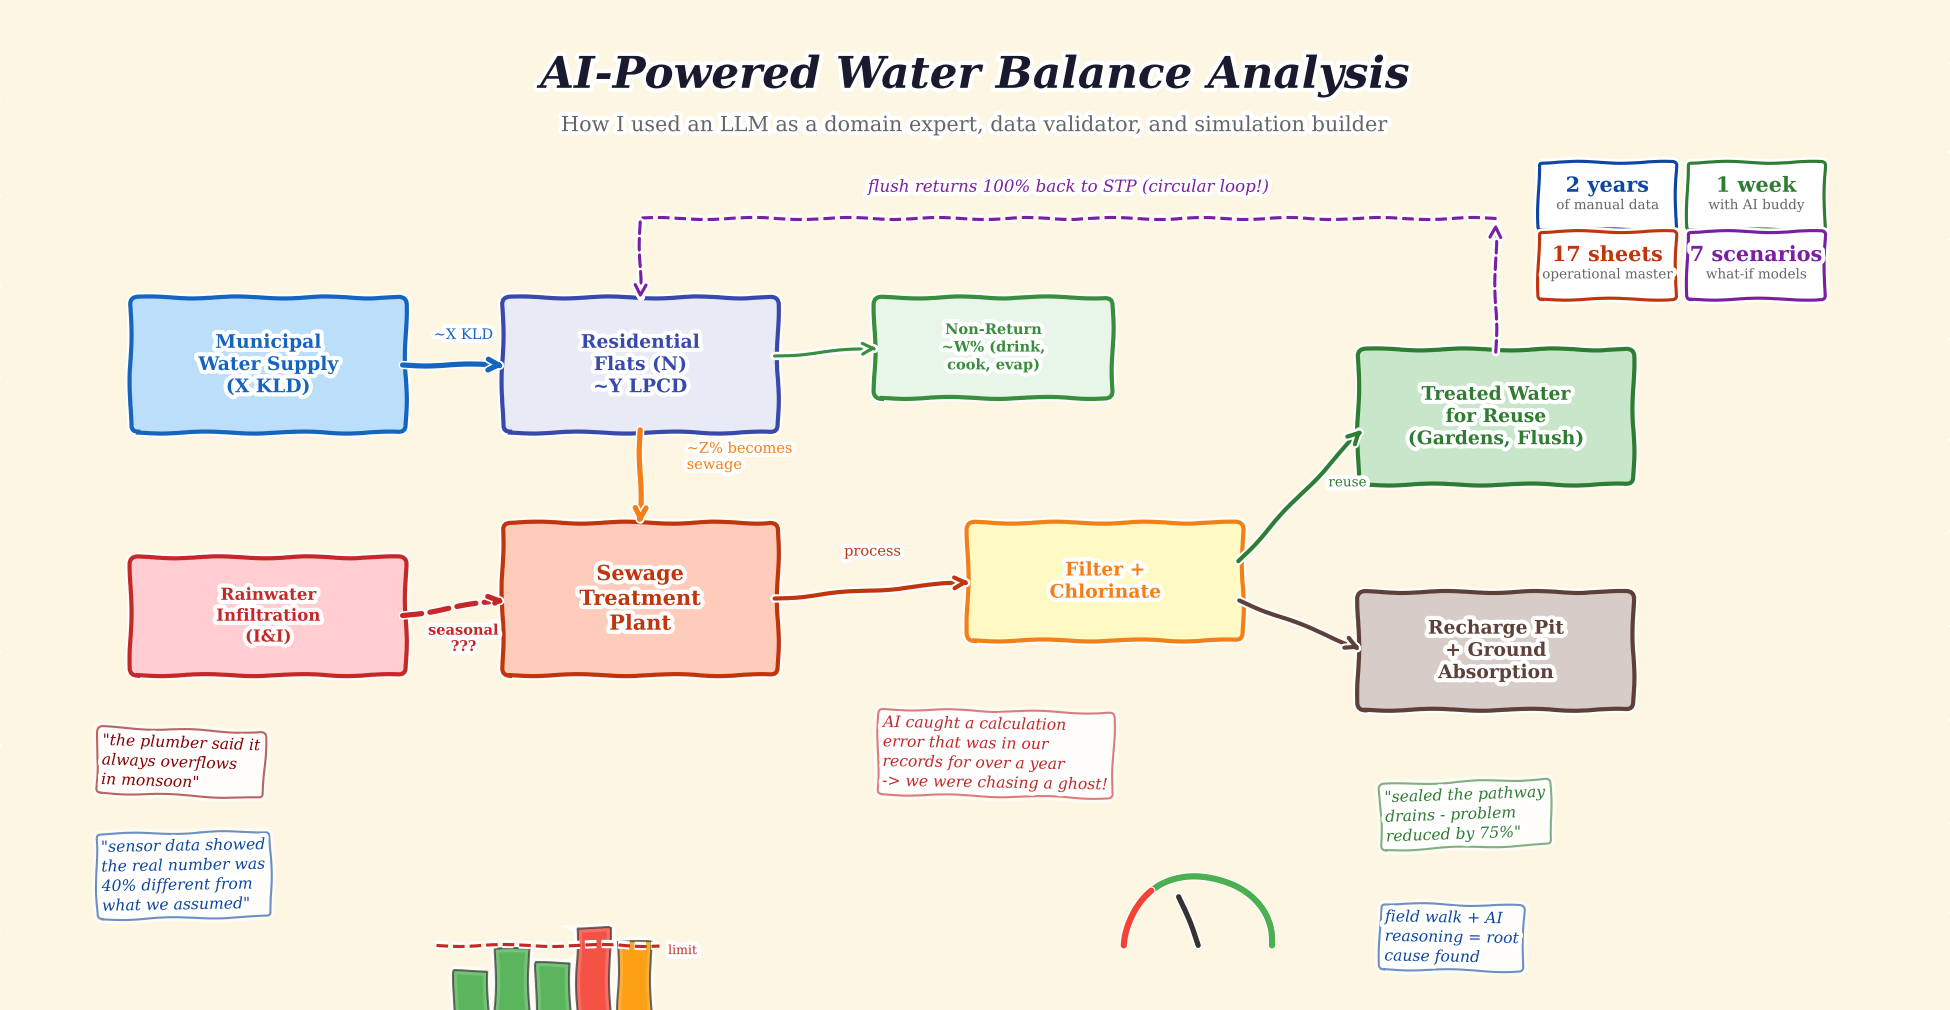
Phase 2 – Water Balance Analysis
This is where things got interesting. I needed to understand the full water balance: how much comes in, what percentage becomes sewage, how much is treated and reused, and critically – how much “extra” water was entering the STP that should not have been there.
I used the LLM as a calculation partner. I would share sensor readings, it would build the formula, I would cross-check against field observations, and we would iterate. The LLM caught a calculation error that had been sitting in our records for over a year – a “ghost” inflow number that previous analyses had been trying to explain with increasingly complex theories. Turns out it was a simple arithmetic mistake in the original model. We had been chasing a problem that did not exist. The fact that consumption and efficiency in some other places increased our fundamental inflow was something we all had neglected!
Nose on the wall, ha!
The corrected water balance revealed the real issue: rainwater was entering the sewage system through pathway floor drains during monsoons – a classic Inflow and Infiltration (I&I) problem. A physical site walk confirmed what the data model predicted. LLM suggested all interventions even the ones I knew and said what should I do to find it given I had fed detailed flow diagram.
Phase 3 – Scenario Modeling
Once the base model was solid, I asked the LLM to help me build seasonal what-if scenarios. What happens in dry season vs monsoon? What if we seal the infiltration sources? What if residents reduce consumption by 10%? What if we install dual-flush systems?
Seven scenarios, each with cost projections and capacity impact analysis. The kind of analysis that would typically require a consulting engagement.
Phase 4 – Deliverables for the Committee
The raw analysis is useless if the committee cannot understand it. I needed to translate engineering data into plain language that non-technical residents could follow. The LLM helped me produce:
- A committee-ready briefing document with visual summaries
- An investigation checklist for the next committee to pick up where I left off
- Cost projections for both completed work and future actions
- An executive summary for the annual general body meeting
Phase 5 – The Simulation App
This was the part that surprised me most. I specified the requirements for a desktop-based water balance simulator in about an hour – sliders for consumption patterns, checkboxes for seasonal conditions and infrastructure fixes, a live capacity gauge, animated flow diagrams showing water movement through the system.
Here is the simulator in action – a compressed 24-hour cycle showing how each tank behaves across a full plumber shift and overnight:
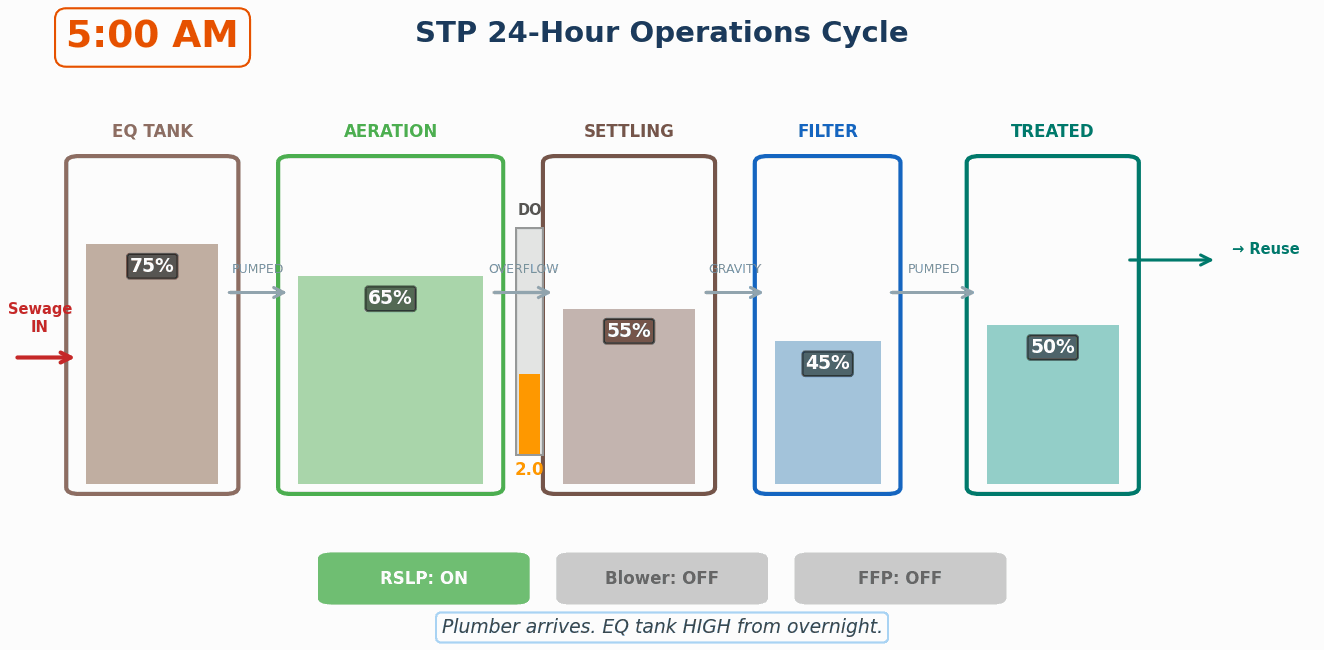
Watch the EQ tank fill overnight when the pump is off, and drain during the day. The DO (Dissolved Oxygen) gauge crashes during the 2-hour blower gaps and recovers when the next blower kicks in. Every tank has independent physics – I caught a bug where the aeration tank was rising after the pump stopped. It should drop. Getting this right required understanding what’s pumped vs. gravity, what’s continuous vs. scheduled.
The LLM (Claude Opus + Claude Code) generated the entire frontend (React-based, standalone, runs on a laptop with no internet). I focused on the data model and validation; it built the visualization and interaction layers. The result is a working proof-of-concept that I can demonstrate live at the general body meeting – residents can see in real time how sealing a drain or reducing consumption affects the plant’s capacity.
Bonus: Phase 6: The Hidden Cost Cascade
Every committee tracks the Cauvery (Water) bill. Almost nobody tracks what that water costs after it goes down the drain…
- Blower overload — more water = higher backpressure at diffuser depth. O₂ margin shrinks from +90 to +6 kg/day
- Pump wear — RSLP, FFP run 30-75% more hours than designed. Motor replacements 2x faster
- Compliance risk — CPCB 2026 norms: BOD<10, DO>4. Overloaded STP can’t reliably meet these!
Every extra KLD costs ~₹Lakhs/year in hidden STP operations cost! The upstream-downstream link is invisible by default. No maintenance ledger connects the Cauvery bill to the STP electricity bill to the pump replacement cost. AI helped me trace the full chain – from one extra shower to ₹5X,XXX/year in hidden STP costs. That single insight changed the committee’s conversation from “STP is fine” to “we need to understand our water budget.”
Where AI Genuinely Surprised Me – Hypothesis to Theory to Application!
Let me be specific about where the LLM added value that I could not have replicated on my own in the same timeframe:
As a domain soundboard. I would describe a symptom (“the EQ tank level rises overnight even when no one is using water”) and the LLM would walk me through possible causes – infiltration, groundwater seepage, leaking valves – with diagnostic steps for each. It was like having a knowledgeable colleague available at midnight. [ This was totally outside work and hence often really midnight 😉 ] This all happened because I had seen this pattern once before as well. I had earlier used an LLM to think through a soundproofing problem around the plant – target noise reduction, material options, procurement considerations, and how to measure whether the intervention actually worked. That gave me early confidence that AI could be useful as a practical soundboard when expert access is limited.
As a cross-validator. Every assumption I made – population estimates, per-capita consumption norms, return rates – the LLM challenged with references to Indian standards (IS:1172, NBC guidelines). It forced me to justify my numbers, which made the final analysis much more robust.
As an error catcher. The “ghost inflow” story I mentioned earlier. I had accepted a number from a previous analysis without questioning it. The LLM, working from first principles, flagged the inconsistency. That single correction changed the entire narrative of what was wrong with our STP.
As a visualization builder. I know data and backend systems. I do not build React frontends for a living. The LLM bridged that gap completely – generating production-quality UI code from a natural language specification. My role was to validate the math and the user experience, not to write CSS.
What I Learned (The Hard Way)
These are not theoretical observations. Each one cost me time, rework, or a moment of “wait, what just happened?”
1. LLMs fail brilliantly. When the context window overflows mid-reasoning, they do not make small errors. They silently drop entire sections of work – worksheets, formulas, validation steps – without any indication that something is missing. I lost a complete worksheet once because the model ran out of context and simply did not include it in the output. No error message. No warning. Just gone. I had to start off from 10 versions behind.
The fix: validate after every step. Not at the end. Every step. Do step 4 to avoid it.
2. Guardrails matter more than specifications. Especially the negative ones. Telling the model “do not modify any sheet other than the one we are currently reviewing” was more impactful than detailed instructions about what to do. If you have worked in enterprise architecture, this will feel familiar – constraints define the system more than features do – Read NFRs.
3. Challenge the LLM like you would challenge a junior analyst. Say “I think you made a mistake here – check this again.” Nine times out of ten, it recalculates, finds the error, corrects it, and – here is the key – internalizes that correction for the rest of the session. This is essentially what Judge LLMs need to do systematically: validate, challenge, and correct after every reasoning step.
4. Decompose ruthlessly. Break the problem into units small enough to validate independently and retract if wrong. If you cannot verify a step on its own, it is too large. I learned this after a batch update corrupted data across multiple sheets because I had asked the model to do too much in one pass.
5. The human is still the architect. The LLM accelerated everything by an order of magnitude. But the domain intuition – noticing that the plumber’s observation about “monsoon overflow” correlated with the pathway drain locations, connecting that to the sensor data anomaly, deciding to physically walk the site to confirm. While I owned this “chain of reasoning”, AI made it faster to act on those insights and critique my iniital observations. It also made mistakes but recovered eventually with right prompts.
The Bigger Takeaway
The gap between “enterprise technology professional” and “community problem solver” is thinner than we think. The same skills – systems thinking, data triangulation, stakeholder communication, iterative design, knowing when to trust the model and when to trust the field – apply whether you are architecting a cloud platform or optimizing a treatment plant.
What has changed is the accessibility of domain expertise. Two years ago, I would have needed a wastewater consultant to do what I did in two weeks. Not because the consultant knows something fundamentally unknowable – but because the knowledge was locked behind specialization. LLMs are flattening that barrier. Not eliminating the need for expertise, but making it accessible to adjacent professionals who bring complementary skills. This goes vice versa for a domain expert to build simulation software with LLMs and not developers.
What is Next
I am exploring what I can open-source from this effort. At minimum, operational templates that any apartment committee can adapt – asset registers, maintenance checklists, log formats, handover documents. Perhaps a longer technical write-up on the water balance methodology. And if there is interest, the simulation app framework itself.
If you are managing infrastructure in your residential community – or thinking about how AI applies to problems outside your core domain – I would be happy to exchange notes.
Disclaimer: I am not a wastewater management expert. I am an enterprise architect with an Industrial IoT background who enjoys solving real-world problems and connecting dots across domains. The best way to learn a tool is to point it at a problem that matters to you.
#AI #LLM #WasteWaterManagement #RealWorldAI #ProblemSolving #EnterpriseArchitecture #IndustrialIoT #ClaudeAI #Copilot #Industrial #sensor #datafoundation #analytics #context #retention #domaindrivendesign
