This conceptual paper introduces the MVH Arc — a framework describing the trajectory by which high-performing professionals, particularly in the technology sector, migrate from being Most Valuable Humans to Minimum Viable Humans. Drawing on peer-reviewed research, WHO data, and industry-specific burnout studies, it argues that the human capabilities being systematically eroded by overwork culture are precisely those that the next decade of AI-augmented work will demand most. The framework is not academic in origin. It is observed. The author writes from the middle of it. It is a conceptual framework presentation at best which can further be explored for realistic empirical studies.
1. The Observation
My LinkedIn feed on a Tuesday morning this week contained 5-10 promotion announcements, 10+ certifications on various AI technologies and two obituaries.
From confetti graphics to AI certification badges to phrases like “excited to announce” to the photograph of the person in early forties perhaps was celebrated for promotion in another cycle.
Nobody connected the two posts. Nobody ever does unless you are the one closely affected.
2. The Connect
This article is an attempt to connect them (submitting that corelation is not causality), not through grief, but through a framework. A framework that I am naming the MVH Arc, and which I am documenting here with a timestamp, because I believe the next decade will make it necessary.
So let me state something controversial. You can call it my journal if you think it is untrue.
“The most valued professional is often the least “valuable” person in the room — and increasingly, the least likely to survive the decade in one piece.
If you’ve spent years becoming “indispensable” at work, this is probably happening to you - Senior ICs transitioning to leadership, managers in delivery pressure environments and other high performers gunning to be partners
3. Is this Anecdotal?
Is the crisis merely anecdotal? — Maybe not.
If overwork is a civilisational problem for the middle aged professional, the technology industry is its leading edge.
The sector that built the tools for always-on productivity has applied those tools most aggressively to its own people.
As for me, I didn’t notice this shift happening. It didn’t feel like a drop. It felt like growth. More responsibility. Bigger projects. Higher stakes. But somewhere along the way, I optimized everything except being human.
4. Evidence
65% of engineers reported experiencing burnout in the past year. The 2025 LeadDev Engineering Leadership Report found only 21% of engineering leaders could be categorised as genuinely healthy — meaning the vast majority are operating in some state of depletion. [1]
67% of IT professionals report experiencing burnout, with System Administrators and DevOps Engineers recording the highest stress levels of any technical role.[2]
Perhaps the most clinically precise description of what is happening in the sector comes from a 2025 study of technology founders by CEREVITY, which introduced the term shadow burnout — defined as persistent exhaustion, cynicism, and reduced efficacy hidden behind continued high performance. The study found that 73% of surveyed founders met the criteria, with 68% actively concealing mental health struggles from investors and board members. [5]
5. My Interpretation
I may argue this is true for high performing professionals within many organizations, often working with high agency and semi-enterpreneurial or highly technical expertise often having to take decisions with platform implications. They are often in AI-induced technostress as mentioned in the Cerevity article, constantly under pressure to know it all, show it all, guide it all and what not!
Every other project and product team will have such an individual often attributed for visionary skills and remarkable turnarounds. Compressed learning and delivery cycle may eventually take a toll on these type of individuals. They will go broke and become less of a human, degrading in parts, if not in full.
6. The Framework Introduction
The Framework: From MVH to MVH – The just career arc for technologists/high performers
We perfected the MVP lingo — Minimum Viable Product. Ship fast. Ship lean. Learn and iterate later.
And the other MVP – Most Valuable Professional became its greatest achievement — certifications, promotions, AI badges, always on, always delivering.
But somewhere between the third promotion and the fifth burnout, the Most Valuable Professional became the Minimum Viable Human.
Functional. Deployable. Impressive on paper. Running on fumes and external validation..
Let me call this progression as
MVH Arc – Most Valuable Human to Minimum Viable Human
The most expensive journey you'll ever take. And the destination and the story arc are not really worth it. Let's admit that not all of are Mr. Robot from the series changing the world through anarchy.
You know this person. You might be this person.
They show up. They deliver. They’re always on. But ask them the last time they laughed without checking their phone, sat with a friend without half a mind on a deadline, or simply did nothing — and watch them go quiet.
They haven’t disappeared. They’ve just been… optimized.
7. The Irony
The decade ahead won’t be won by the most optimized human in the room. That’s for the agent to be.
It will be won by the most human human in the room.
People with judgment. Empathy. Presence. The ability to sit with another human being and actually see them. That is the scarce resource AI cannot manufacture.
These are what AI cannot replicate. And we are systematically destroying them in ourselves, in the name of growth.
The decade ahead desperately needs Most Valuable Humans and less of MVPs.
8. Where am I?
I’ll be honest because this post deserves honesty. I have never been the most valued human in my own evaluation.
I have measured myself in output, in delivery, in whether I was useful enough. The professional scorecard was always full. The human one I kept meaning to get to that. This post isn’t wisdom from the other side. It’s a note from the middle of it while the change is in progress.
Don’t let career growth outrun identity stability. Be identifiable in the end.
Drift & yet remain purposeful, like a solid, driftwood.
10. In conclusion
Most people don’t burn out. They slowly stop being fully human. And nobody notices — because the system rewards it.
The rat race doesn’t announce itself as dangerous. It just asks for a little more.
One more late night. One more certification. One more quarter.
FOMO does the rest because everyone else seems to be sprinting within the same cage. So stopping feels like failing until we faint.
But the most valuable thing you can be in the next ten years isn’t the most optimized professional in the room.
It’s a whole person who showed up. Someone worth knowing, not just worth hiring.
11. Remember
You are not a product. Stop shipping yourself into the ground.
There’s a better GitVersion of you out there, imperfect and unoptimized. You are not a costly GPU!
Know your life’s pace before you outpace.
Don’t be “Certified” Dead, at some point we all will anyway be one!
Don’t go from most valued to minimum viable human.
~ From one MVH professional to another ~
References
Wellhub. (2025). U.S. Work-Related Stress in 2025: Key Stats & Solutions.wellhub.com
DORA / Google Cloud. (2024). State of DevOps Report 2024. As cited in IT Support Group, 2025. thisisanitsupportgroup.com
State of Engineering Management Report (2024) as cited in CIO Magazine (2025); LeadDev. (2025). Engineering Leadership Report 2025.leaddev.com
Ketamine MC. (2026). Is the Tech Industry Facing a Mental Health Crisis?ketamc.com
CEREVITY. (2025). Shadow Burnout Among California Tech Founders: The Hidden Crisis Behind High Performance. Survey of 127 founders conducted January–December 2025. cerevity.com
Loaiza, I. & Rigobón, R. (2025). The EPOCH Framework. MIT Sloan School of Management. As cited in Futureneers, 2025. futureneers.io
EY. (2026). Redesigning Work Around Human Skills in the Age of AI.ey.com
From Paper to production story of Human + AI – How I used LLMs as a domain soundboard, data validator, and simulation builder to manage my apartment’s sewage treatment plant!
The Setup
For the last two years, I have been voluntarily managing the sewage treatment plant of my residential apartment complex. Not because I am a wastewater engineer – “I am not” but because nobody else on the committee had the bandwidth (or so they told), and I had the curiosity to question things as I stayed closer to its vicinity . Also, managing STP was brutally hard, this space was notorious with frequent mails, shouting fixes and what not! So, in a way, this was also forced upon me. In hindsight, it was a blessing in disguise for me to learn something new and apply technology meaningfully.
What started as “just keep it running” slowly turned into something more complex. The plant was showing signs of overload during monsoons. The operator (humble plumber) said it was “always like this.” The trigger point was the helplessness of our plumber when he said, “There is so much water and you tell me what to do with it!”. The previous committee had limited documentation. The logs were inconsistent. The regulatory filings used assumptions that did not match what I was observing on the ground.
I had questions. How much water are we actually consuming? Where does it go after use? Why does the STP overflow seasonally? Is rainwater getting into the sewage line? Are we even compliant?
I had no budget to hire a consultant. What I had: two years of manually collected operational data, sensor readings from a couple of installed meters, hand-drawn site maps, commissioning documents from regulatory authorities, and field knowledge from our plumber who has been maintaining the system for years. Given my background (next segment), I had ensured that in my two year tenure, we approach this data driven, if manually collected. So, in 2 years, I had this body of work to assimilate Very Important
And I had access to something that did not exist two years ago – large language models that could reason across domains. In its absence I was a bit lost manually doing this number crunching and modeling.
My Background (and the Gap)
My day job involves enterprise platforms and Industrial IoT. I have spent years working with sensor data, systems architecture, data pipelines, and building solutions that connect operational technology with information technology. So the analytical side – collecting data, structuring it, building models, thinking in systems – came naturally to me.
What I lacked was the wastewater domain knowledge. I did not know the standard hydraulic retention times for an aeration tank. I could not tell you what MLSS levels indicate healthy biology. I had no reference for what percentage of domestic water typically becomes sewage in an Indian residential context.
I was genuinely curious: could an LLM fill that gap? Not replace an expert, but act as a domain soundboard – the way a knowledgeable colleague would if I were brainstorming at a whiteboard?
What I Did
I spent roughly two weeks in deep collaboration with an LLM (primarily Claude, with some use of GPT for cross-validation and M365 Copilot for enterprise document workflows). Here is what that collaboration looked like:
Phase 1 – Data Collection and Structuring
I fed in two years of manual logs, sensor data exports, hand-drawn P&ID diagrams, regulatory documents, and field observations. The LLM helped me structure this into a normalized format – a 17-worksheet operational workbook covering asset inventories, maintenance schedules, daily logs, chemical dosing records, and process parameters.
This alone would have taken me weeks manually. With the LLM, it took about two days of iterative back-and-forth.
Phase 2 – Water Balance Analysis
This is where things got interesting. I needed to understand the full water balance: how much comes in, what percentage becomes sewage, how much is treated and reused, and critically – how much “extra” water was entering the STP that should not have been there.
I used the LLM as a calculation partner. I would share sensor readings, it would build the formula, I would cross-check against field observations, and we would iterate. The LLM caught a calculation error that had been sitting in our records for over a year – a “ghost” inflow number that previous analyses had been trying to explain with increasingly complex theories. Turns out it was a simple arithmetic mistake in the original model. We had been chasing a problem that did not exist. The fact that consumption and efficiency in some other places increased our fundamental inflow was something we all had neglected!
Nose on the wall, ha!
The corrected water balance revealed the real issue: rainwater was entering the sewage system through pathway floor drains during monsoons – a classic Inflow and Infiltration (I&I) problem. A physical site walk confirmed what the data model predicted. LLM suggested all interventions even the ones I knew and said what should I do to find it given I had fed detailed flow diagram.
Phase 3 – Scenario Modeling
Once the base model was solid, I asked the LLM to help me build seasonal what-if scenarios. What happens in dry season vs monsoon? What if we seal the infiltration sources? What if residents reduce consumption by 10%? What if we install dual-flush systems?
Seven scenarios, each with cost projections and capacity impact analysis. The kind of analysis that would typically require a consulting engagement.
Phase 4 – Deliverables for the Committee
The raw analysis is useless if the committee cannot understand it. I needed to translate engineering data into plain language that non-technical residents could follow. The LLM helped me produce:
A committee-ready briefing document with visual summaries
An investigation checklist for the next committee to pick up where I left off
Cost projections for both completed work and future actions
An executive summary for the annual general body meeting
Phase 5 – The Simulation App
This was the part that surprised me most. I specified the requirements for a desktop-based water balance simulator in about an hour – sliders for consumption patterns, checkboxes for seasonal conditions and infrastructure fixes, a live capacity gauge, animated flow diagrams showing water movement through the system.
Here is the simulator in action – a compressed 24-hour cycle showing how each tank behaves across a full plumber shift and overnight:
Watch the EQ tank fill overnight when the pump is off, and drain during the day. The DO (Dissolved Oxygen) gauge crashes during the 2-hour blower gaps and recovers when the next blower kicks in. Every tank has independent physics – I caught a bug where the aeration tank was rising after the pump stopped. It should drop. Getting this right required understanding what’s pumped vs. gravity, what’s continuous vs. scheduled.
The LLM (Claude Opus + Claude Code) generated the entire frontend (React-based, standalone, runs on a laptop with no internet). I focused on the data model and validation; it built the visualization and interaction layers. The result is a working proof-of-concept that I can demonstrate live at the general body meeting – residents can see in real time how sealing a drain or reducing consumption affects the plant’s capacity.
Bonus: Phase 6: The Hidden Cost Cascade
Every committee tracks the Cauvery (Water) bill. Almost nobody tracks what that water costs after it goes down the drain…
Blower overload — more water = higher backpressure at diffuser depth. O₂ margin shrinks from +90 to +6 kg/day
Pump wear — RSLP, FFP run 30-75% more hours than designed. Motor replacements 2x faster
Every extra KLD costs ~₹Lakhs/year in hidden STP operations cost! The upstream-downstream link is invisible by default. No maintenance ledger connects the Cauvery bill to the STP electricity bill to the pump replacement cost. AI helped me trace the full chain – from one extra shower to ₹5X,XXX/year in hidden STP costs. That single insight changed the committee’s conversation from “STP is fine” to “we need to understand our water budget.”
Where AI Genuinely Surprised Me – Hypothesis to Theory to Application!
Let me be specific about where the LLM added value that I could not have replicated on my own in the same timeframe:
As a domain soundboard. I would describe a symptom (“the EQ tank level rises overnight even when no one is using water”) and the LLM would walk me through possible causes – infiltration, groundwater seepage, leaking valves – with diagnostic steps for each. It was like having a knowledgeable colleague available at midnight. [ This was totally outside work and hence often really midnight 😉 ] This all happened because I had seen this pattern once before as well. I had earlier used an LLM to think through a soundproofing problem around the plant – target noise reduction, material options, procurement considerations, and how to measure whether the intervention actually worked. That gave me early confidence that AI could be useful as a practical soundboard when expert access is limited.
As a cross-validator. Every assumption I made – population estimates, per-capita consumption norms, return rates – the LLM challenged with references to Indian standards (IS:1172, NBC guidelines). It forced me to justify my numbers, which made the final analysis much more robust.
As an error catcher. The “ghost inflow” story I mentioned earlier. I had accepted a number from a previous analysis without questioning it. The LLM, working from first principles, flagged the inconsistency. That single correction changed the entire narrative of what was wrong with our STP.
As a visualization builder. I know data and backend systems. I do not build React frontends for a living. The LLM bridged that gap completely – generating production-quality UI code from a natural language specification. My role was to validate the math and the user experience, not to write CSS.
What I Learned (The Hard Way)
These are not theoretical observations. Each one cost me time, rework, or a moment of “wait, what just happened?”
1. LLMs fail brilliantly. When the context window overflows mid-reasoning, they do not make small errors. They silently drop entire sections of work – worksheets, formulas, validation steps – without any indication that something is missing. I lost a complete worksheet once because the model ran out of context and simply did not include it in the output. No error message. No warning. Just gone. I had to start off from 10 versions behind.
The fix: validate after every step. Not at the end. Every step. Do step 4 to avoid it.
2. Guardrails matter more than specifications. Especially the negative ones. Telling the model “do not modify any sheet other than the one we are currently reviewing” was more impactful than detailed instructions about what to do. If you have worked in enterprise architecture, this will feel familiar – constraints define the system more than features do – Read NFRs.
3. Challenge the LLM like you would challenge a junior analyst. Say “I think you made a mistake here – check this again.” Nine times out of ten, it recalculates, finds the error, corrects it, and – here is the key – internalizes that correction for the rest of the session. This is essentially what Judge LLMs need to do systematically: validate, challenge, and correct after every reasoning step.
4. Decompose ruthlessly. Break the problem into units small enough to validate independently and retract if wrong. If you cannot verify a step on its own, it is too large. I learned this after a batch update corrupted data across multiple sheets because I had asked the model to do too much in one pass.
5. The human is still the architect. The LLM accelerated everything by an order of magnitude. But the domain intuition – noticing that the plumber’s observation about “monsoon overflow” correlated with the pathway drain locations, connecting that to the sensor data anomaly, deciding to physically walk the site to confirm. While I owned this “chain of reasoning”, AI made it faster to act on those insights and critique my iniital observations. It also made mistakes but recovered eventually with right prompts.
The Bigger Takeaway
The gap between “enterprise technology professional” and “community problem solver” is thinner than we think. The same skills – systems thinking, data triangulation, stakeholder communication, iterative design, knowing when to trust the model and when to trust the field – apply whether you are architecting a cloud platform or optimizing a treatment plant.
What has changed is the accessibility of domain expertise. Two years ago, I would have needed a wastewater consultant to do what I did in two weeks. Not because the consultant knows something fundamentally unknowable – but because the knowledge was locked behind specialization. LLMs are flattening that barrier. Not eliminating the need for expertise, but making it accessible to adjacent professionals who bring complementary skills. This goes vice versa for a domain expert to build simulation software with LLMs and not developers.
What is Next
I am exploring what I can open-source from this effort. At minimum, operational templates that any apartment committee can adapt – asset registers, maintenance checklists, log formats, handover documents. Perhaps a longer technical write-up on the water balance methodology. And if there is interest, the simulation app framework itself.
If you are managing infrastructure in your residential community – or thinking about how AI applies to problems outside your core domain – I would be happy to exchange notes.
Disclaimer: I am not a wastewater management expert. I am an enterprise architect with an Industrial IoT background who enjoys solving real-world problems and connecting dots across domains. The best way to learn a tool is to point it at a problem that matters to you.
Musings – While I have been working on IoT related projects, there was a lot buzz around sustainability esp. Sustainability and the role of IoT in it. Thanks to my organization’s imperatives of learning, reaching a level 100 was not a big deal. During that time, I realized there are broadly two branches – Sustainability in Technology and Sustainability with Technology, my work being in the latter. While researching on this topic, along with my friend and colleague Roopa Shivani (Data Architect), we took a slight digression to investigate the literature on Green(er) Software (Sustainability in Technology – using Technology optimally to solve problems and not use everything at disposal even when it is not needed). Below is the material from the outcome – our point of view based on publicly available material on this topic.
Disclaimer: My company is part of Green Software Foundation which leads the sustainability in tech branch of industry evolution, thought leadership and standardization. This is an independent article without any proprietary information or sponsorship done at our spare times.
Abstract
In the era of moving on-premises systems to cloud based ecosystems, the basic ask from customers is about scaling the existing systems to a greater number of available resources with ease. This is aided by the seamless hardware expansion on demand, by thoughtlessly increasing the computational power in order to get the right outcomes. Our hardware systems have undergone many evolutions to accommodate high performing computational engines which obviously consume higher energy with GPUs and parallel processing. Increasing software workloads like bitcoin mining, Deep learning use cases with the need for better hardware amplifies the problem multifold. Our collective objective to remain planet friendly is to look at the opportunities where energy consumption can be reduced by designing optimum hardware and software. We look at software here as part of the below paper.
Introduction
In 2018, online video viewing generated more than 300 MtCO2, i.e., as much greenhouse gas as Spain emits: 1% of global emissions. [1] [2]
The greenhouse gas emissions of VoD (video on demand) services (e.g. Netflix and Amazon Prime) are equivalent to those of a country like Chile (more than 100 MtCO2eq/year, i.e. close to 0.3% of global emissions), the country hosting the COP25 in 2019[1][2]
The lead scientist, Rabih Bashroush, calculated that five billion downloads and streams clocked up by the song Despacito, released in 2017, consumed as much electricity as Chad, Guinea-Bissau, Somalia, Sierra Leone and the Central African Republic put together in a single year.[1][3]
Training a single natural language processing model produces as much CO2 as 315 return flights from New York to San Francisco.[1] [4]
The conservative studies estimate that the information and communication technology sector accounts for 4% of electricity consumption and 1.4% of carbon emissions worldwide .[1] [5]
The above stated and many similar studies highlight the importance of designing workloads that respect the energy for computation vs the actual need. One important concept that comes to the table is the role of Green Software which can also be read as sustainable coding. This emerging discipline puts forth the basic principles where we use the right language for the right task at hand and run it efficiently. Can this reduce the energy emissions and make our planet greener?
Green Software and Sustainable Coding
Green or sustainable software is developed and run in a way that ensures maximum energy efficiency and has minimal or no impact on the environment. There are two broad ways of looking at software in the context of sustainability – software as part of the climate problem and software as part of the climate solution. Building green software and doing it at scale requires the creation of a trusted ecosystem of people, standards, tools and best practices. The mission of Green Software Foundation is exactly that. [5]
The 8 principles of Green Software Engineering [6]
Carbon: Build applications that are carbon efficient.
Electricity: Build applications that are energy efficient.
Carbon Intensity: Consume electricity with the lowest carbon intensity.
Embodied Carbon: Build applications that are hardware efficient.
The answer lies in the two philosophies of sustainable software:
Everyone Has a Role in Fighting Global Warming and Climate Change
In this connected world every drop counts. To achieve our climate goals on a global scale, we need as many hands-on deck as possible. People with skills across industry, engineering and design are needed to create both conventional and unconventional solutions. So every sustainable line of code makes an impact.
Sustainability Alone Is Enough to Make Your Efforts Worthwhile
Sustainable software applications are often cheaper, better-performing, and more resilient than their conventional counterparts. However, the main reason to invest in green technologies should be sustainability itself. Everything else should be considered as bonus.
While it is a given that green software engineering is for reducing carbon emissions, like every project it needs to have its own business outcomes without which any attempt at this field will die within organizations.
Some of its advantages include:
Simpler architecture. Sustainable application architecture has fewer interdependencies. As a result, green software systems tend to be more straightforward and energy efficient. Case in point is moving to a simpler language or reducing parallel processing there by keeping the processor load low, using simpler languages and libraries.
Faster computing speed. Simpler systems make for faster software. Single threaded powerful workhorses are sufficient if the business outcome is not affected.
Low resource usage. Green systems use fewer resources, which translates into long-term cost savings. Either at local laptop or cloud level, resources can be reduced if we are reducing massive parallelism, consistency management, synchronization etc.
Brand resilience. Consumers today care about the integrity and social responsibility of their service providers. By raising awareness about environmental issues and reducing your carbon footprint through green software development, you can foster brand loyalty and resilience.
A Green Software & coding handout for developers
The next obvious question would be how shall we incorporate this into our software lifecycle. Often, we look at opportunities in efficient software development during implementation. The design phase is an outcome of several analysis at depth and necessary technical guard rails have to be added during that phase, if you are serious about green software. PoCs to finalize the design and implementation should ensure best coding practices. Most of the application development functional requirement does not target lowest energy consumption (which can be at times a hidden non-functional requirement). This presents the need of targeting the principles and objectives of Green Software right from the beginning phase of software development keeping it as one of the main requirements.
What handout could we give to our architects, leads and developers to ensure they choose the right software solution respecting the functional and non-functional requirements ?
Let us look at it from SDLC perspective – whether it is waterfall/staggered/agile elements of the below ideas should go into respective areas cyclically to ensure adherence to sustainability.
Requirement phase
Coding language of choice
There are a lot of scholarly articles comparing the coding language of choice which says C++ and C being the optimal and the likes of python, typescript being the least sustainable languages. Whereas many of the image AI libraries are in python on the contrary. Hence, during the requirement phase, choosing the right language is a tricky problem for the architect or developer!
One may need to weigh in many people factors like developer availability, developer’s preference, ease of maintenance, organization’s IT priority. There is a lot of dependency between green and brown software coding languages based on their developer friendliness and organization choice [11]. Let us not confuse the green and brown here with sustainability. In this context, green is about a developer preferred language which is often used like C#, Scala or Python versus brown like C, C++, Java etc. This ensures that most of the available libraries, source code samples on GitHub are all on these languages making it even more difficult for future developers to choose another sustainable language.
Sustainable programming languages battle the above developer choices. Architects often yield to the developer affinity and organizational choice to manage project execution speed.
If we are ready to go beyond that, then we can look at green coding and software.
Here the factors to measure are time, energy and memory [12]. Depending on whether we are working on a massively parallel financial software, scheduled batch analytics of a maintenance report, an IoT device application collecting and streaming data or a machine learning algorithm, our yardsticks or weightage between the 3 factors will vary. The reference [12] details the analysis to compare the languages choosing 2 among the factors and all the 3 together, where programming language C seems to the safest choice.
But we all know that C doesn’t fit into those full stack developer friendly languages. It is important that we look at application sustainability [14] deeper than the coding languages. Application workload may influence the language choice or have a larger sway on the factors like the IoT device which has low memory and need to optimize battery usage. So the jury is out there until we find the holy grail and middle path between green language for sustainability and developer love. The data here provide an initial attempt at choosing a better option.
In the context of this, what is important is to have a guidance that aligns well with good coding practices to optimize space and time complexity (that is the business case for green coding to ensure that we at least maintain the right coding practices which improves the 3 factors articulated here based on application or workload scenario).
Batch I/O operations to reduce frequent I/O access
Full readof data from filesystems to perform next operations should be done if the data size is less and within the memory capacity limits. This prevents accessing filesystem multiple times for each row/column. This will store all data in memory. All operations will then be performed in memory. If the input filesystem data is huge, full read may lead to out of memory exceptions. So ideal case would be to know the memory limits and decide whether to do a full read or read in batches which will still avoid reading every row every single time. If the scenario is real time streaming, verify if micro batch operations fulfill the requirement rather than going for line by line reading. Can this read be done on-prem without sending data to public internet reducing energy in transit?
Batch read/write records in database based on partitions if exist or Select Filter Query
Micro batch operations as well can be performed for near real time operations
Caching the objects not changing frequently. Caching is retaining not so frequently updated objects in memory. Although this prevents from accessing I/O frequently, it ends up adding cache related complexity and custom cache software.
Memory Consumption optimization
Type Sizing – One of the deciding factors of memory consumption is the size of the data type defined in the program.The smaller data type uses less memory. Despite the previous statement being so obvious, many standard programs have the assignments of integer data type while the actual value never expected to cross the boundary of size of short data type.
Analyzing the possible lowest and highest range of the actual value will help in choosing the right data type. The possibility of only non-negative(positive) values will further help in reducing the size allocation by 50%. For example, if the value is not going to exceed 32767 and cannot fall below -32768, then it is safe to declare the data type short than integer. If the value is only expected to be positive, then it can further cut short the allocation by declaring as unsigned short.
Making Garbage Collection faster
In case of .Net, when a new object is created, it is moved to Generation 0 of Garbage collection. The object keeps promoted to next subsequent higher Generations 1 and 2 if the object is still referenced. Objects in generation 0 are collected frequently and efficiently. Generation 0 holds very small memory in heap and thus least expensive while Gen 2 is the most expensive which includes the maximum memory space and is also called as Large Object Heap.
.Net exposes collect method of GC which forces the system to try to reclaim the maximum amount of available memory. All objects, regardless of how long they have been in memory, are considered for collection; however, objects that are referenced in managed code are not collected. However, The best practice is to not to call the GC.Collect() explicitly. Referencing object multiple times is expensive compared to creating objects as it keeps moving to higher generation when the existing gen level is getting garbage collected. The best way to prevent the objects moving from Gen 0 to Gen 2 is to prevent referencing objects frequently.The exception to this remark is the most used design pattern Singleton where object forever stays in memory however the intent of using singleton is for least expensive utility functions like logging, caching, database connections etc.
Weak References
The garbage collector cannot collect an object in use by an application while the application’s code can reach that object. The application is said to have a strong reference to the object. A weak reference permits the garbage collector to collect the object while still allowing the application to access the object. A weak reference is valid only during the indeterminate amount of time until the object is collected when no strong references exist. When you use a weak reference, the application can still obtain a strong reference to the object, which prevents it from being collected. However, there is always the risk that the garbage collector will get to the object first before a strong reference is reestablished.
Weak references are useful for objects that use a lot of memory but can be recreated easily if they are reclaimed by garbage collection.
There are multiple ways to detect memory leakage either using profiler, task manager or diagnostic tool window. The objective here is to highlight the prime sources which may cause memory leak.
The best practice is to use the using statement which in turn uses a try / finally statement behind the scenes, where the Dispose method is called in the finally clause.
Unregistering the user defined event handler from the event by implementing IDisposable.
Any type of caching mechanism can easily cause memory leaks. By storing cache information in-memory, eventually, it will fill up and cause an OutOfMemory exception. The solution can be to periodically delete older caching or limit caching size.
Efficient Data Structures, selecting less energy-greedy data structures
The mutable collection types in lower in algorithmic complexity to their corresponding immutable counterparts. Often immutable collection types are less performant but provide immutability – which is often a valid comparative benefit.
Approximate Programming, to reduce unnecessary precision of computations
Many applications perform computations targeting higher accuracy than required in actual which results in more consumption of resources. The objective of Approximate Programming is to deliberately reduce accuracy to save memory and energy.
In case of computations, often the double or decimal precision point is used where floating precision can just be sufficient. The below table shows the precision ranges of datatypes.
C# type/keyword
Approximate range
Precision
Size
float
±1.5 x 10−45 to ±3.4 x 1038
~6-9 digits
4 bytes
double
±5.0 × 10−324 to ±1.7 × 10308
~15-17 digits
8 bytes
decimal
±1.0 x 10⁻²⁸ to ±7.9228 x 1028
28-29 digits
16 bytes
The decimal type is appropriate when the required degree of precision is determined by the number of digits to the right of the decimal point. Such numbers are commonly used in financial applications, for currency amounts.
Design Phase
Design phase efficiency depends on the deep understanding on requirement, with the ability to design the architecture framework with loosely coupled rules and abstracting the low-level information which should be flexible to extended at later steps. Define methodology to measure, report and correct deviations using platform logs.
.Net has defined reusable design patterns for multiple use cases which can be used in combination to solve the problem.
Infrastructure Design
Create infrastructure that is sufficient and scalable instead of over provisioning. In the case, of migration or optimization of existing infrastructure where workloads are run, there are tools and assets from vendors and system integrators to scan, plan and to optimize. if we need to run workloads at the edge and then cloud separately, then plan for it.
System design and platform design should be important for architects and product managers. Poor design may cause increase in energy consumption, say an UI polling a backend continuously using old world unoptimized APIs without improper caching or not co-locating servers when there is regular access needed. Such improper design can lead to lot of changes and platform refactoring later. Frequent calls over network for redundant data, an improper back-end design to represent data could be major blockers in impacting the performance and energy consumption. The design should also consider the nature of end user need and the domain criticality. For example, if the data at end user tool is not critically monitored then the use of real time pipelines can just be overkill and overutilization of resources, a simple one-time (2-3 times a day) batch process can handle the data updates instead running them every second/minute.
The experiments performed by Sahin et al. [2012] and Bunse et al. [2013] performed empirical studies where they compared the energy consumption of selected patterns. Their observation indicated that Particularly the Flyweight, Mediator and Proxy patterns resulted in energy savings when applied on selected applications, while the Singleton and Decorator pattern tremendously increased energy consumption.
Energy Optimization and Run Time Performance of Design Patterns & Data Structures
Bunse et al. focused on evaluating the energy consumption and run-time performance impact of design patterns on Android applications. The authors observed an increase in both energy consumption and execution time after applying six out of the 23 design patterns (Facade, Abstract Factory, Observer, Decorator, Prototype, and Template Method) on selected applications.
Structural changes in the design patterns can lead to significant energy optimizations as presented by Noureddine and Rajan [2015]. Their experiment revealed the Observer and Decorator as the most energy-greedy design patterns. The authors transformed the existing source code, by reducing the number of created objects and function calls and accomplished important energy savings. Specifically, after optimizing the Observer and Decorator design patterns, the authors reduced the applications’ energy consumption by 10%, on average.
Choosing the right data structure is also as important as design patterns considering some data structures are costlier than the others without any apparent additional benefits in terms of number of graph traversals versus a dictionary versus a map.
Implementation Phase
Class Libraries Performance
Avoid the need for synchronization, if possible. This is especially true for heavily used code. For example, an algorithm might be adjusted to tolerate a race condition rather than eliminate it. Unnecessary synchronization decreases performance and creates the possibility of deadlocks and race conditions.
Make static data thread safe by default.
Do not make instance data thread safe by default. Adding locks to create thread-safe code decreases performance, increases lock contention, and creates the possibility for deadlocks to occur. In common application models, only one thread at a time executes user code, which minimizes the need for thread safety. For this reason, the .NET class libraries are not thread safe by default.
Avoid providing static methods that alter static state. In common server scenarios, static state is shared across requests, which means multiple threads can execute that code at the same time. This may cause threading bugs which is highly energy consuming. Consider using a design pattern that encapsulates data into instances that are not shared across requests. Furthermore, if static data are synchronized, calls between static methods that alter state can result in deadlocks or redundant synchronization, adversely affecting performance. [11]
Parallel Programming
While parallel programming was in the cautionary list earlier, it is needed in certain other areas. This may sound contradicting but certain services on cloud are built for parallel workloads natively like Azure Data factory from Microsoft.
Data Level Parallelism
The data level parallelism is performed to run the same action on divided several chunks of data simultaneously instead either doing sequentially or running all in one go. The best approach is to divide the huge data and assign it to multiple threads/tasks to perform the action simultaneously.
Instruction Level Parallelism
While above the data is divided to perform same action, here actions are broken into parallel steps to speed up the total execution time. Here, one of the best examples can be ETL pipelines or any pipeline where the instructions like reading the data from multiple source systems can be run in parallel and different transformations based on nature of data can also be run on parallel than running as sequential steps.
Thread/Task Level Parallelism
Parallel execution of actions either my threads or Tasks are now a days over burned with the presence of easily configurable available high-end machines in the cloud. The number of threads using Thread pool or Task Parallel Library should be validated with the available configuration to benchmark the optimal numbers.
AI – Data, Storage, Training ML-Ops Cycle
Storage is cheap and getting cheaper. PaaS software gives the necessary cloud designs of replication, availability and the likes. Prebuilt algorithms to clean, learn and re-learn aided by DevOps help the MLOps run day in and day out without much value. Design should incorporate the need of the hardware infrastructure to run this MLOps and optimize it. As of today, a lot of energy is wasted in trying out newer algorithms for minimal % gains from monetary value and continuously running it.
Source Code Analysis
This is a technique by which tools detects the defects and vulnerability in software before deployment. There are many profilers or analyzer tools which efficiently detect these aspects of software. The objective is to target the following (roughly falls in performance improvement which affects energy consumption)
Unreachable code detection: Multiple such block in entire software results in blocking more unused storage.
Unused Variables: The cases where variables are declared and assigned with default value in beginning however it’s not called in the entire program. For example, defining double, string, long type of datatypes results in higher consumption of memory if not used at later stages.
Unused Functions: The functions defined but never called by any module of software.
Better code usage recommendation: The absence of efficient disposal of unmanaged resources will result in memory consumption when it is no longer needed.
There are many rules which identifies the vulnerabilities and defects as out of box feature of these tools. These tools also help in identifying the issues in code if go unnoticed.
Application Deployment
The deployment of software in dev, stage and production environment could lead to more energy consumption especially in prod if the dev ops pipeline is not well designed. Since the software is already running in 3 environments which means 3 times, the energy consumption is already high.
Evaluate how many environments we really need for a platform: while you need multiple environments could 2 environments, DevOps and a human in loop be an efficient solution as compared to 3-4 environments and end to end automation.
Minimum bugs in subsequent stages: Test Coverage should be more emphasized and automated test runs should be encouraged to detect the bugs faster and majority of bugs in dev itself. The most common practice is to keep dev environment with low power resources compare to stage and stage can be still low compared to prod environment. Hence the bugs leak into production. This repeats the test runs in all previous stages, thus the new deployment and test in production stage.
Automating the monitoring dashboards: This could be built in feature of cloud provider or third-party tool configurable which will help in monitoring overall all resources usage and help in identifying the bottlenecks.
Clean up deprecated Processes/Jobs: The development environment at times comprises of multiple combinations of tasks that are running jobs which will not be used later. It is necessary to identify the additional resources created for temporary purpose and clean them up to avoid space and energy consumption. This is application code repositories which are built even after refactoring or cleaning up.
Testing & Verification Phase
Framework, Tools and Benchmarking
The framework and tools enable the testing phase execution at ease. The benchmarking is one of the initial levels of agreement where the project decides the various KPIs to benchmark the software for its release to production. The best practice helps in defining the goals and targeting right from the initial phase.
The automated test framework development at unit test level helps in detecting the bugs at functional level and exposing the majority bugs. This reduces the number of repetitions of executions and deployment at stage or production level. The benchmarking here could be the defect leakage in subsequent stages. For example, the project team can define one of the KPI as no more than 10% of defects leakage to subsequent stage as a standard.
The code coverage tools help in detecting the efficiency of code coverage and hence reduces the additional code, memory and storage capacity. The benchmarking in percentage of code coverage sets the goal in defining the efficiency of the code. For example, the project team can set minimum 70% of code coverage for the project.
The memory and performance tools help in detecting the memory and performance imprint and hence taking actions on saving the energy.
The Load Test analyzers can be run locally and in cloud to understand the load usage of resources in that environment.
But the important point is to move away from aimless end to end automation to human monitored, AI/ML based automation in the DevOpsworld else we will be running large verification cycles without any major gains and with large energy expenditure.
Conclusion
There may be a lot more viewpoints out there. These are something that authors felt is a good starting point to debate on this. The above may seem like a summary of best coding guidelines from last decade. Partly that is true. We knew this.
Commonsense design, coding and management may make our software more carbon efficient.
To conclude, the authors here believe that soon enough the software editors like visual studio with plugins will be available to give options and suggestions to coders, much like Grammarly and Microsoft word suggestions to authors like us, to use an alternate expression or data structure based on the engineering and domain related benchmarks. Add to that an expert’s careful consideration of the technical requirement and business need behind it – functional and non-functional.
[10] Software Development Life Cycle for Energy-Efficiency: Techniques and Tools by STEFANOS GEORGIOU, Athens University of Economics and Business, Singular Logic S.A. STAMATIA RIZOU, Singular Logic S.A. DIOMIDIS SPINELLIS, Athens University of Economics and Business
Much has been written about Metaverse over the last few months. So called the “New Internet” or the “New Application Experience” has become a part of our extended lexicon more that what we may want, but, the truth is, there many more hurdles before it becomes an indispensable part of our daily life, like mobile apps and websites. Perhaps that is why Gartner marked it a good 10 years away from becoming part of our behaviours.
From a component architecture perspective, there are a lot more moving parts to this stack. Yet there is one specific aspect of this new concept that deserves attention – The Industrial Metaverse. This is spoken in conjunction with IIoT, Industry 4.0 and 5.0 with much fervor.
Just like me, you may wonder, we always had digital twins and what is the new angle here! Let us understand a few things before we peel the architectural onion of Industrial Metaverse.
Everyone has been talking about – “let us build a Digital Twin” quite synonymous with metaverse and plain simple 3D model visualization of machines and plants, which is half the truth. A good looking, interactive 3D model or an ability to show some data on top of 3D models or a simulator with 3D models attached is not a Digital Twin! At least, I don’t subscribe to that definition.
How do I see the Industrial Metaverse forming? - From an evolution of Virtual models and OT technology solutions.
Product Engineering teams always had high resolution, detailed 3D models of various formats, with companies like Dassault systems giving good workbenches to import, build and simulate pre-created scenarios in order to test faults on these machines – Virtual Twins. These concepts started moving further into plants and processes with the question – why are we not using these models to monitor actual plants and their operations. But then they were siloed with singular models from the vendor platforms whereas the processes definitely sat outside of those platforms in the plant ecosystem. They had sophisticated simulators but then they were not a software representation of the actual plants, assets and processes. Also, it didn’t work hand in hand with other vendor machines and their simulators. Most importantly, real data could never stream into these workbenches.
On the other side, manufacturing execution platforms and hyperscaler platforms like Azure and AWS were wondering about helping factories and plants with real time representation of their shop floor data, securely, at scale – to model assets & process, to predict events, to prevent the scenarios using Industrial Platforms. They were expanding their plant or cloud knowledge moving from OT to IT, or IT to OT.
Value chains were getting extended. Both of them were searching for a / set of software services to bridge this chasm of real time data and process handshake, each partnering or building full stack solutions.
Note: All the while, manufacturing plants were looking for value and not expensive technologies!
Let us call the middle region as Digital Twin – a software representation of the assets, processes, and behaviours that memoise the system, contextualize data inside the system, and raise events based on the connected behaviour of system workflows, like a point in time. I often call this as the working memory of the system with a limited playback capability. This crucial component adds to the real time nature of the system in between.
This Digital Twin is the secret sauce to having a good Virtual Twin on the top and a low latency (autonomous or condition based) control feedback to Industrial Platform below.
Paraphrasing one of the Siemens executive’s statement (will be attributed once I figure out the details)
Consumer metaverse may not need real time data but industrial metaverse needs real time data to succeed.
Hence, the platform in the middle with the bindings between the layers should bring the real time data view of the plant / factory / industry to the virtual world seamlessly (making the metaverse possible).
You could see from the earlier rough sketch that there are broadly 2 interfaces needed to make this happen. One that elevates the virtual twin experiences to make it closer to Metaverse experience continuum mentioned in the earlier blog of mine. And the next, of getting real time information from the OT / physical ecosystem within factory. These 2 are integral to changing the current status quo of plain 3D models with data to a metaverse application.
The Visualization Interface for Metaverse Apps
Virtual Twin with the Digital Twin binding is what creates the entire universe of Metaverse Apps which are highly responsive, rendering of the plant that enables us to seamlessly access a particular machine in a plant and troubleshoot remotely. Definitely that needs infrastructure support like 5G and 6Gs but also some like of spatial software support for seamless collaboration and space sensing. The component architecture I can think of is Microsoft Mesh. I don’t want to repeat Microsoft documentation here.
I believe that the link above gives a very good idea of how that platform should evolve to give the seamless B2B2C experience that I was mentioning in my previous blog. It talks of the immersive presence, spatially anchored maps, rendering acceleration, multi user shared experiences, streaming data, security, an Out of the Box SDK that enables application layer acceleration with the data binding from the API layer below (digital twin layer).
I would like to add that, this experience should be as simple as listening to Microsoft Teams on mobile MS Teams App and transferring the call to a desktop MS Teams application with just a simple button click, without any latency. Also, in the context of Industrial Metaverse, this would be much easier to setup as you can have dedicated infrastructure like 5G, Active Directory based secure logins inside wearables, controlled devices, limited number of users simultaneously logging in and the like. This can ensure that we guarantee similar infrastructure at network, connectivity, device, security layers with ample governance like today’s internet and the devices used to access information from within a manufacturing facility.
2. The Data Interface for Industrial Data
With numerous firewalls and air-gapped networks from factory floor to internet, this was one is a tougher interface. Good news – This is almost a solved problem, thanks to many of the private and hybrid networks, high security interfaces, localized secure processing on purpose made hardware, limited data exposure, one way communication that avoid command and control interfaces etc. This limits the exposure of OT, at the same time gives as much data and processing needed, at speeds and latency acceptable to populate the Digital Twins in the cloud middleware. Also, the fact is that many of the hyperscalers have software runtimes and stack that start from the cloud and extend to the edge within OT. MES systems are upping the game with their stack starting from the Edge synchronizing to the cloud. This gives opportunity to run reactive, predictive and preventive workloads within Edge and cloud, with visualization and actions that can go back and forth Physical Space and Digital Twin.
With these 2 interfaces maturing, you can possibly have the Industrial Metaverse sooner than a Consumer Metaverse. May be it is already here.
There are a lot of innovative solutions from PTC, Azure, AWS, Siemens etc. their numerous partners and many Solution Integrators etc. showcased and deployed to clients. Many such light solutions, or wannabe Metaverse solutions are already PoC-ed or used at Industrial facilities, for example, check out this build session. towards the 20th minute. This detailed Microsoft blog (image below) with examples give the full stack view of their Industrial Metaverse. Here, the digital twin layer, abstracted in my blog, holds the Azure AI and autonomous systems, Synapse Analytics, Azure Digital Twins together to build the middle stack. Azure IoT is the Data Interface for factory, Microsoft Mesh is Visualization Interface for Metaverse Apps built on HoloLens like devices. Power Platform is part of the Digital Twin layer but the application interface called PowerApps is still in Metaverse. I am sure an expert on another stack will have something similar.
As per the case studies presented here, helping us build simple digital representations, virtual worlds, autonomous self correcting systems and more.
To summarize, I believe the Industrial Metaverse is already here in many forms, in its many light weight avatars.
Our joint effort should be directed towards creating the right experience continuum within the use cases, to create tangible and usable solutions for the end personas helping them – to remotely collaborate, to improve the first time fix rates ,to visualize the impact of predicted changes, to build muscle memory of operators and the like.
Disclaimer: Author works for Accenture and uses Microsoft services to architect and build Manufacturing platforms and Applications on top of it.
Somewhere during the first half of 2017, our team was experimenting with Unity 3D based applications for Field Service maintenance scenarios. It brought together many technologies, some of which were in its nascency. Solution contained Mixed Reality application on HoloLens with a Digital Twin of a machine, AI to detect the machine, dynamic data rendering, contextual IoT data based on that machine, Skype calling with annotations, multiple people and multi device collaborations, action system to take in voice and gesture commands, integration with Microsoft D365 and warranty management on blockchain.
Quite over the top you may say. This was much before the Microsoft’s out of the box Field Services application like Remote Assist was released. And, my role was to ensure that we harmoniously blend the latest and greatest technologies to create a useful solution for Remote maintenance and field services.
Each of the technologies we had brought together to solve complex maintenance issues were independently interesting and collectively captivating. We went ahead, created a solution with some quirky nuances and applied for a patent during October of 2017.
It was an idea whose time had not come. It would later be called as “Metaverse“!
American author Neal Stephenson in his 1992 science fiction novel Snow Crash first called the concept in which humans interact with each other in a virtual reality based world, the next internet aka “metaverse”.
We understood that it is one thing to do a PoC and thought leadership exercise but totally different ball game to bring so many technology mashups without confusing the user and having real life adoption.
So what was that we built vs what are we talking about now!
For that, I guess you would need to recall the narrative we had about Internet of things a few years back. We always had sensors at home and industries, various protocols, ability to issue commands, programmable devices etc. What was so different about Internet of Things anyway? The common explanation was, it was the maturity of those new and independent technologies to interoperate, collect, ingest, make sense, predict, prevent, act, through edge and cloud, and the scalability of this platform. This overall maturity and the cost benefits, enabled new use cases to be envisioned. Today, we are ok with sharing our heart beat with technology companies, and as operators of manufacturing plants ready to share sensor heart beats (and data) with platform vendors, securely, in the hope that it will help predict and prevent failures!
Argument is the same.
While the technologies we used in our patent pending innovation of 2017 were similar to what we see today, all of them have attained a higher level of maturity. Massively parallel multi player video games on virtual realities, GPU enhancement, web3, NFTs, collaboration stack, secure data shareability, avatars, robust decentralized data systems, advance networks, 5G speeds, AI generated personas and deep learning and the likes, lower cost of entry, all come together, to bring that “new brave world”, where we can exist in a parallel world – both professionally and personally.
Metaverse Component Model
The different components have come under an easier name to tell the concept to everyone. But,
“We were learnt the difference between a Metaverse vs metAverse Application!”
the hard way.
The less spoken magic word is maturity of technology and experience. Fast forward to today, these 2 may seem commonsense terms, considering the cycles of websites, apps, OSes, mobile devices, tablets that we have been through. But, come metaverse, we will be grappling with another maturity curve where this will be repeated.
Before 2017:
I have been leading mobile applications and its experiences over a variety of platform building applications for enterprise clients. Starting off with Symbian and Qt apps, I transitioned to Microsoft, Android, iOS app store world. This journey would roughly be like the below graph where we tried unifying technology for development but still had native platforms to competing to create rich apps. Soon, we had too many applications fighting for our constant attention. Enterprise users were struggling to find their apps amidst the BYOD era. Some had work and personal phones separated out to manage this distraction. Eventually, we needed a single phone but then people started asking application aggregation on phones to avoid noise and security. In a few years, we discovered new features that could be augmented in phones – Gamification (one of our earlier patent for mobile gamified experiences), Siri, Cortana, assistants, Augmented Reality, advanced sensors on phones and we had a gamut of deep applications which were irreplaceable. Most became fancy features, until we realized that Application augmentation needed to have an experience that is worth the recall or monitory value. Thus finally we started looking for the holy grail of experience continuum, where there is smooth handoff between new features and new devices from the existing.
Note: Meanwhile, gamers kept playing multi player games on all form factors 🙂
This realization perhaps gave me Experience Aversion towards ill conceived continuums. I believe that is what we have to understand in this new wave as well. Else, our rush to create metaverse experiences will rather become aversion for the same experiences we fondly construct, making it MetAverse!
Experience abstraction and designing the continuum..
My experience building the Field Services app was based on these learnings where we tried to segregate human experiences.
Sensory Experiences in general –
Visual, Audio, Olfactory (smell) and Tactile, Neural – how we are going to get augmented by these?
Visual is easy – AR/VR/MR – By now, most of us have experienced this from 360 immersive videos to VR to AR to MR across various form factors and devices, tethered and untethered experiences.
Audio – Aural AI – I still think this is much more powerful that what we have experienced so far. Why? I believe this is one of the only distractions that a human brain allows while doing another task – typing , walking, running etc. True multi tasking can be achieved when you are listening to something repetitive like classical music along with your work or something interesting like audio book while doing a chore like folding clothes. Much of my thoughts in this area has been inspired from the movie HER . At some point in future, AI agents like Siri and Alexa will break out of the existing imagination into much more pervasive systems.
Olfactory and tactile – are touch and smell based systems – While not much used, this was researched and embedded into our demonstrations as fingerprint sensors, magnetic and electric vibrations to understand cloth textures remotely.
Neural – using devices like Emotiv, sensors which could approximately understand human actions and emotions could one day help create better systems was what we had researched. We tried to create synthetic experiences based on actual experiences. While devices we had were quite evolving, our ideas were to understand inherent human behaviours during mundane, repeated tasks like electronics repair.
These design experiences had to be compared in the context of below 4 use case archetypes
Product Design
Maintenance Jobs
Learning & Training Sessions
End Customer Experience
for every single persona, be it design engineer/s in a product design team working on a CAD model OR a maintenance staff learning about part disassembly and assembly to build muscle memory OR a customer experiencing a custom dress before an in-store experience.
Put all of these together and you will get a matrix like the one below.
Such objective vision of subjective experiences, helped us understand which experiences are good during what phase. what may cause more distraction, helping us understand the VR and MR’s role in Designing products, Training employees whereas VR and AR’s relevance for (B2C) customer experiences.
I suggest a Metaverse enthusiast to really understand the nature of the application, personas and the human experiences really well to create meaningful experiences. The technology stack that define a metaverse application like VR, GPUs, networking devices, AI, web3 etc. will mature eventually to create that seamless continuum. This seamless continuum is a 3 Dimensional – Experience continuum, Application continuum and Technology continuum.
Words of Caution In our pursuit to create a superior metaverse application which is not experience averse, we shouldn’t push our unsuspecting users into a dystopian hyperreality.
Trilok R | September 2022
Next: Industrial Metaverse, Digital Twin, Virtual Twin – Beyond the narrative..
I have been meaning to try out the cooking hacks EHealth Sensor kit for sometime now. My first attempts didn’t go well thanks to the changing supporting libraries and my impatience browsing all forums!
Though it was interesting, I was facing a lot of compilation issues since the version I had for the sensor, arduino and the libraries shared by cooking hacks makers were incompatible.
Off late with the second wave of covid, I started using the sensor again. So I thought why not give it a try again to get the data onto internet. This time of course, I was able to get the errors fixed with the below actions
Arduino version – I had to delete my Arduino 1.8 version and move back to 1.0.6 old version.
Refer to the link and pick up the right version for EHealth and PinChangeInt Libraries based on your time of purchase.
with the above two steps properly done, I was able to compile and upload my code correctly for Arduino Leonardo board.
Now comes the bad part! 😦
ReadPulseOximeter() methods was not working! So the interrupt trigger was not working for some reason. I tried changing the pininterrupt library to the latest version. Somehow didn’t help.
So I moved the code to Loop() and tried called the C++ method from here directly. While the device display showed the SP02 and BPM accurately, the data I got from the library on Arduino Serial monitor was highly inaccurate!!! I tried changing the libraries and the delay in the eHealth.cpp but with that didn’t change the accuracy of output. Al this while though the device showed proper readings on its native display. I believe it is somehow related to segToNumber method and the delay.
Serial monitor data
Source code is here (not much different from the existing source code) except for the direct call to Cpp library..
So what next?
-> Investigate the data accuracy issue by updating the Arduino library EHealth file, esp the segToNumber & the delay.
-> Interface the shield to Raspberry PI, use its libraries and see if the accuracy is better than Arduino libraries
While working with IoT and website deployment and testing, we will be in need of certificates. We end up using OpenSSL to generate strong certificates (mostly Microsoft blogs will guide us on how to do that). Most of these blogs will guide us on how to get that done.
Recently working on a web deployment to IoT edge containers, I was trying to secure the website with a self signed certificate. It was working all fine locally. But strangely when deployed to container, the container starts and shuts down immediately.
After a bit of good old trouble shooting and isolating the problem, I realized that it works from my Windows machine and not Mac machine! to be specific when the certificates were generated from Mac container version of my website didn’t load. Why?
Windows had OpenSSL by default. Whereas my Mac had LibreSSL by default and the encryption on that didn’t help.
Face -palm moment..
“Ensure that you have proper libraries for SSL before you dockerize and copy certificates to your container.”
Though the blog shows that path, that is not ideal from a security standpoint. But I wanted to troubleshoot, why wouldn’t the Kestrel hosted website not work inside the container. So was trying to isolate the problem.
It is quite a known pattern to use Azure Stream Analytics (ASA) to create data pipelines to store ingress IoT data to an output location be it a SQL Server or EventHub or Azure Storage etc. This is all the more important when push ASA to the edge and use that as a data transformation and storage orchestration engine esp. with SQL Server on local on premises being used like a Historian. This seems to a straight-forward process but here comes a small catch and technical/product limitation of Azure. It took us a few precious hours to understand this aspect.
Short Answer (if you have scrolling like me):
“If you want to connect ASA with SQL server, ensure that you have a trusted CA certificate with proper certificate chain installed in the SQL server VM”.
For the patient ones who need the backstory 🙂 read along..
What were we doing?
We were trying to wire up an Azure IoT edge module with a SQL server on a VM! This seemed quite easy as per the documentation but I ended up with a curious certificate error.
As a troubleshooting step, I tried to create this on ASA on cloud and connect with the same SQL server on VM to rule out any Edge VM certificate issues. This should be quite quite simple if we follow this blog.
Set Force Protocol Encryption Client Setting to Yes
For secure connectivity, ensure that the client and server both require encryption. Also ensure that the server has a verifiable certificate, and that the TrustServerCertificate setting on the client is set to FALSE.
Created self signed CA certificates and installed them as well. But then still the issue seems to be coming back and back.
Solution
Finally, we found out from Microsoft product team that we need proper CA certificates with certificate chain from well known authority to make ASA and SQL work together.
One requirement for SQL server on VM as output to work is that the SQL server needs to be configured with an SSL certificate issued by a trusted CA. There is no workaround with this. You can’t use a self signed certificate or use TrustServerCertificate=True and change SQL Server settings.
1- Regarding SSL Certificate – Make sure to use the DNS based FQDN for the CN. Here are the full requirements listed.
2- SSL Setup in the VM – Follow steps here. If using SQL 2016 , Also put the certificate’s thumbprint in the registry key mentioned in the “Wildcard Certificates” section.
Now for me who is just doing a dev setup and doesn’t have the luxury of client CA certificates, there are quite limited options.
For IoT Edge, I used a custom .NET code with SQL DB client to communicate with SQL server VM using the TrustSeverCertificate = True flag in connection string for dev code until I get a CA cert.
But for Azure Stream Analytics PaaS service, we can’t enter connection string. So there is no way to enter TrustSeverCertificate=TRUE during development. Sure seems like a restriction.
One another way which is to use services like Let’s Encrypt and generate a chained certificate for your use temporarily. Something which I am yet to try. I think that should work.
If you have used that and worked, please let me know in the comments.
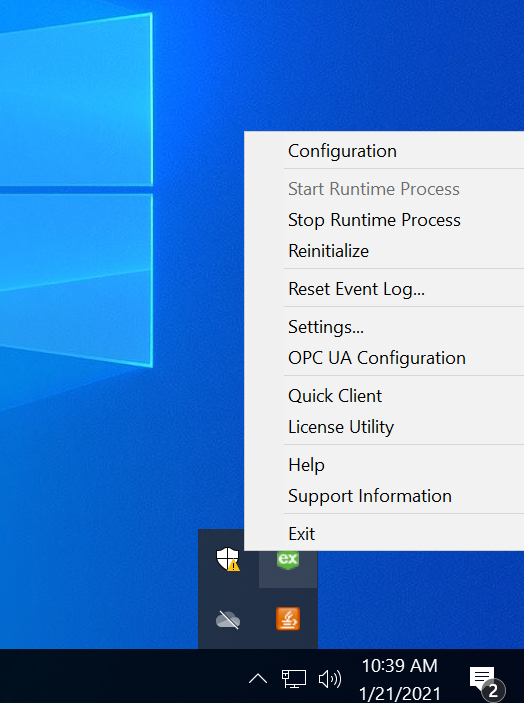
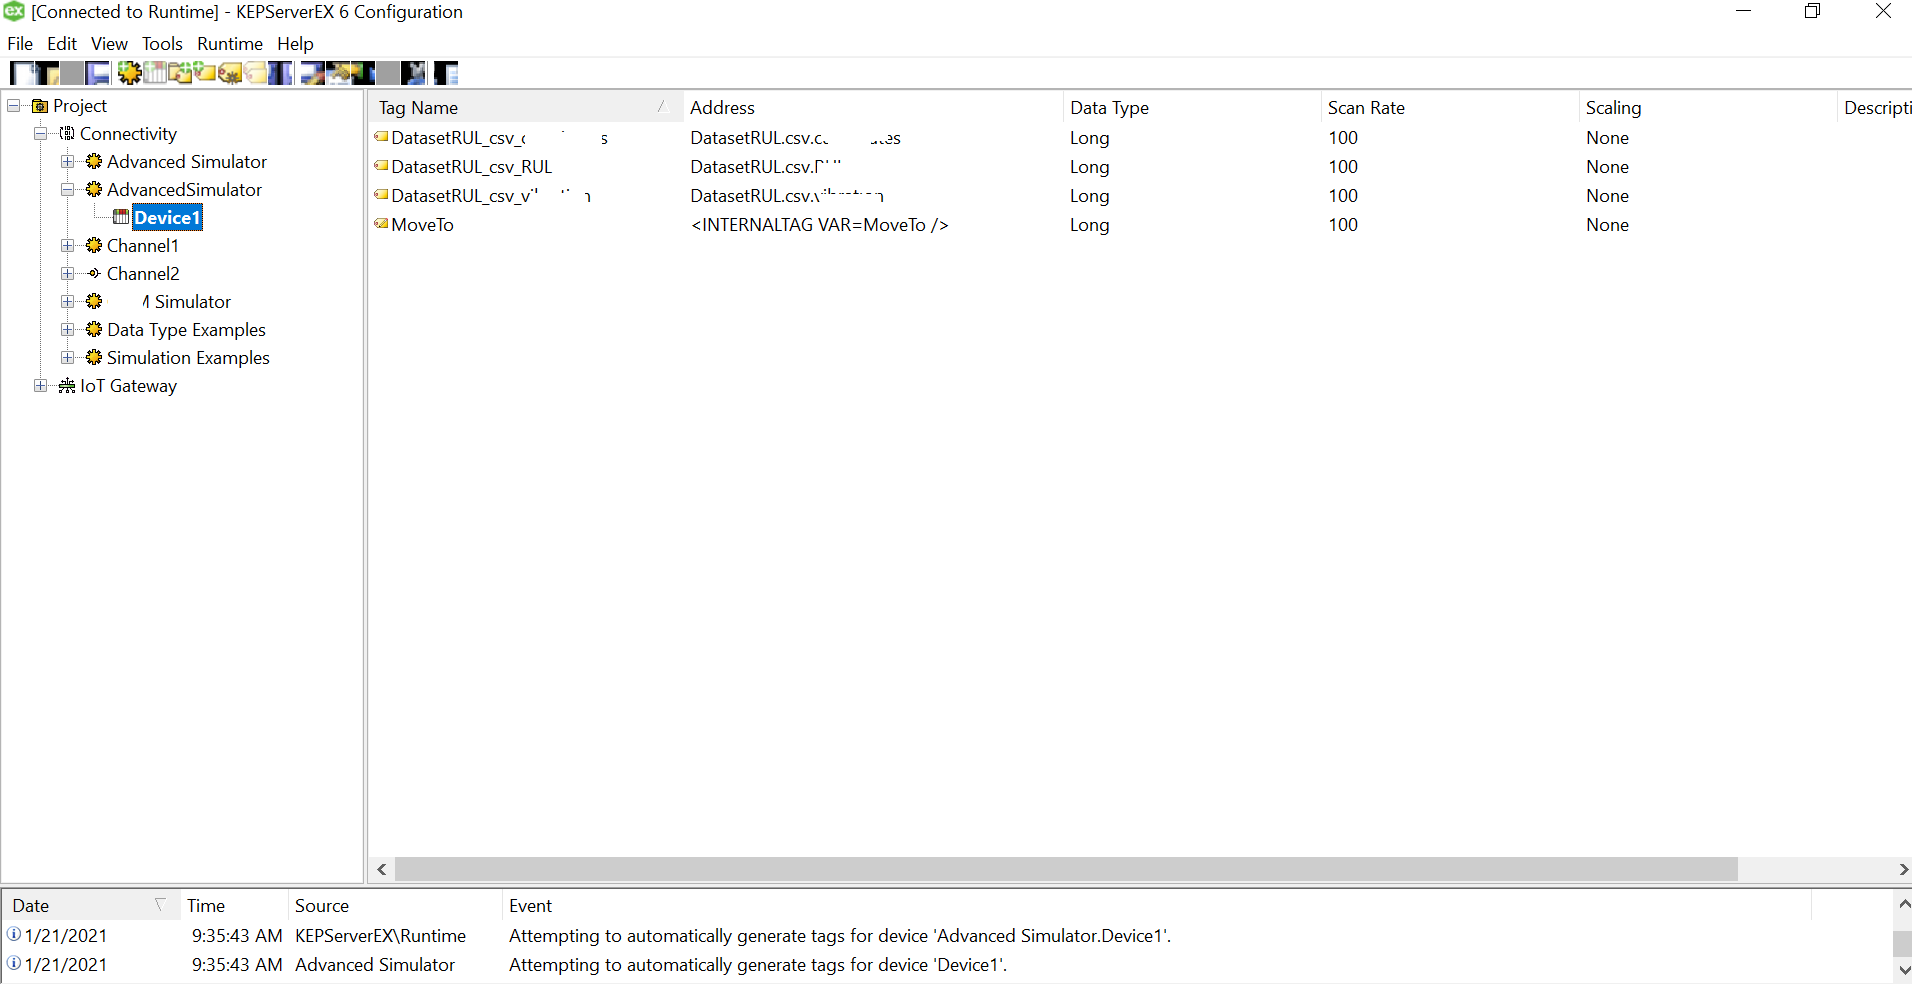
Off late, I have been working with Industrial IoT projects with Kepware Server, Azure IoT Edge and IoT Hub. During one of those, there was an ask to use an excel file with hand crafted data to be used as input data source at the edge. While investigating options including writing custom module at the edge to read the excel and send row by row, I realized that Kepware Server can be used along with Advanced Simulator. Being a noob on Kepware this was quite a surprise.
As I started configuring this, it took sometime to get this up and running and definitely a few steps and caveats along the way. So I thought why not give the screenshots and walk you through the steps and configuration needed.
Before I got ahead thanks to my friend Akhila (akhilahebbar@outlook.com) for troubleshooting and figuring out some of these specific roadblocks which a noob like me was trying to figure out from manuals.
Let’s us go ahead and deep dive into the Kepserver Ex and learn the specifics of using Advanced Simulator driver.
Simulator Setup
Let us create a new channel and set the type of the channel to be Advanced Simulator
Provide a useful/meaningful name to the channel and proceed.
Since we won’t be changing much of the default settings for this demo, let us leave the next pages as is and proceed.
Let us add the data source.. this is where csv is used. Click on the “Configure DSN” and Hit the Add Button on the right of the pop up window.
We need to select the driver for data source. We have an xls file with multiple columns. We converted that into a csv file, so we could use a Microsoft Text Driver (*.txt,*.csv).
Give a meaningful name to the data source and after that select the directory where you have stored your converted csv files, with columns having your simulated data. Ensure that your headings are meaningful as that become your tag values. Also, make sure it doesn’t have space between the text or leading spaces. That will make the tag reading erroneous.Use “Define Format” feature to select the columns and guess the tag rows. That will help you know if the file is being read correctly. If there are changes to delimiters and stuff we can give all those customizations here. We had a standard csv.
Click on Ok and we are done with the Data Source Name creation with the files specified in the folder.
Select the data source that just got created under the “Add Channel Wizard” and click Next.
Click “Finish” to complete adding the Channel.
We need to add device that can now read the files from the data source. Right Click on the Channel that got created previously and click on “New Device” to get started.
Setting up a device
Choose a meaningful name for the device and leave the next window as default in the wizard.
Setting the “Initial Updates from Cache” to “Enabled” helped us create those tag values automatically. Leave the Next wizard as default until choosing TableClick on the three dots and select the soecific csv for this device from the data source mapped earlier while setting up channel.
Specify the file read rate in the record selection interval. Please note that the time is milliseconds. Enable looping so that you get continuous stream of data once the cycle gets over. Please note that you need to repeat these steps for all the devices and its CSVs. but those devices timestamps may not be synchronized necessarily. it starts counting whenever it is setup and running.Click Finish and the device is successfully added, the driver should be able to “Generate” the TAG names from the column names. In case, the logs indicate an error as below, you may want to change OPC configuration settings to resolve it.
Ensure the user has administrator access on the Kepware so that he can access the kepware administration application as shown below. [It is accessible over the tray icon at the right bottom of the windows ]. Click on the “Settings” and Find and Navigate to the “Runtime Process” Tab. Change the selected mode to “Interactive”
Apply the settings and “Re-initialize” / Stop and Start the Kepware server instance.
The Tags should now be auto generated, and the simulator should be able to read the data from the files successfully.
This can now be pushed to either to the IoT Hub or Edge device to process it further!
What I am going to document here might be straightforward for certain people but wasn’t obvious to me when I started doing a very silly List template copy in MS Teams. Hence this post!
As part of my work, I am in a Microsoft Teams, let me call it Team 1, where I have a SharePoint List, let me call it TrackerList, added as a tab. This list helps our team add certain requests with their details and attachments.
As you might be already aware, it is a simple task to add a new List as a tab – Link
Now, comes the interesting bit. I had to manage the same task in another Team, let us call it Team 2, where this same TrackerList’s template was needed. Since, I was not a SharePoint / Teams regular user, I was in a spot.
So, as usual, I started analysing the options.
OPTION 1: I started with this link from techcommunity.
Go to the underlying SharePoint site for Teams in the Teams where my Original Tracker List was there.
You will be taken to your SharePoint that drives your Teams. on the Site Navigation pane on the left side you can see your TrackerList file.
Click on that to Open your SharePoint List, click on Export to Excel and save the query.iqy file.
Open the file and Enable the data concern in the security pop up window as long as it is allowed in your machine (some firewalls and companies don’t allow this) and source of file is vetted.
Now, you have the excel sheet with the data from SharePoint.
Go to Table->Design-> Export the table to a SharePoint List.
I gave the Link to my SharePoint that drives Teams2.
I was able to use the Next and Finish to publish it with a New Unique name to that end point (provided I had access)
Go to Team2’s SharePoint backend.
Now, you can’t see that it in the site Navigation pane
But you can see it in the Site Contents.
You can try adding it to Site Navigation Pane using Edit.
But after all this, you can’t see it in the below flow when you want to add this List as a tab to your Teams 2.
Now, I don’t know why this happens. May be there is some meta which is needed. if you create a new List from this SharePoint base link, then it appears on Site Navigation by default and then comes in Add List as Tab workflow as well!
OPTION 2: Let me try create a new List from the import the freshly created List in the above option 1
How to achieve this?
Create a New List Item but then I wasn’t able to copy it from a template!
Dead End
Start over:
Go to Site Contents instead
Create a New List
you get a new Window now where you are by default in your own Site and can see the different Lists created or imported from Option 1.
you can choose to create a list from the previously exported Lists!
Now go back and try to add this list in Teams 2.
Oops. Doesn’t appear still
OPTION 3: Let me try now using the imported list in the Site Contents and somehow create a new List.
Instead the steps are actually too simple!
Go to Site Contents instead
Create a New List
you get a new Window now where you are by default in your own Site and can see the different Lists created or imported from Option 1.
you can choose to create a list from this – BUT DON’T as we saw in option 2 that doesn’t work
you should scroll below to the other Teams, Team1 and the specific list you need will be there.
Select whichever lists you need and click Create.
Done – you will have the same template without the data created for you!
And, I am happy saving 2 hours copying templates and recreating them.
Now you may ask me a question what if my sample template and SharePoint List is in another Tenant!
I don’t have an answer for that yet. I somehow think Option 1 and Option 2 together should solve it, with some support from Microsoft end to say why MS Teams, Add SharePoint List is not showing the List added in that fashion. May be some metadata is missing when added like that.
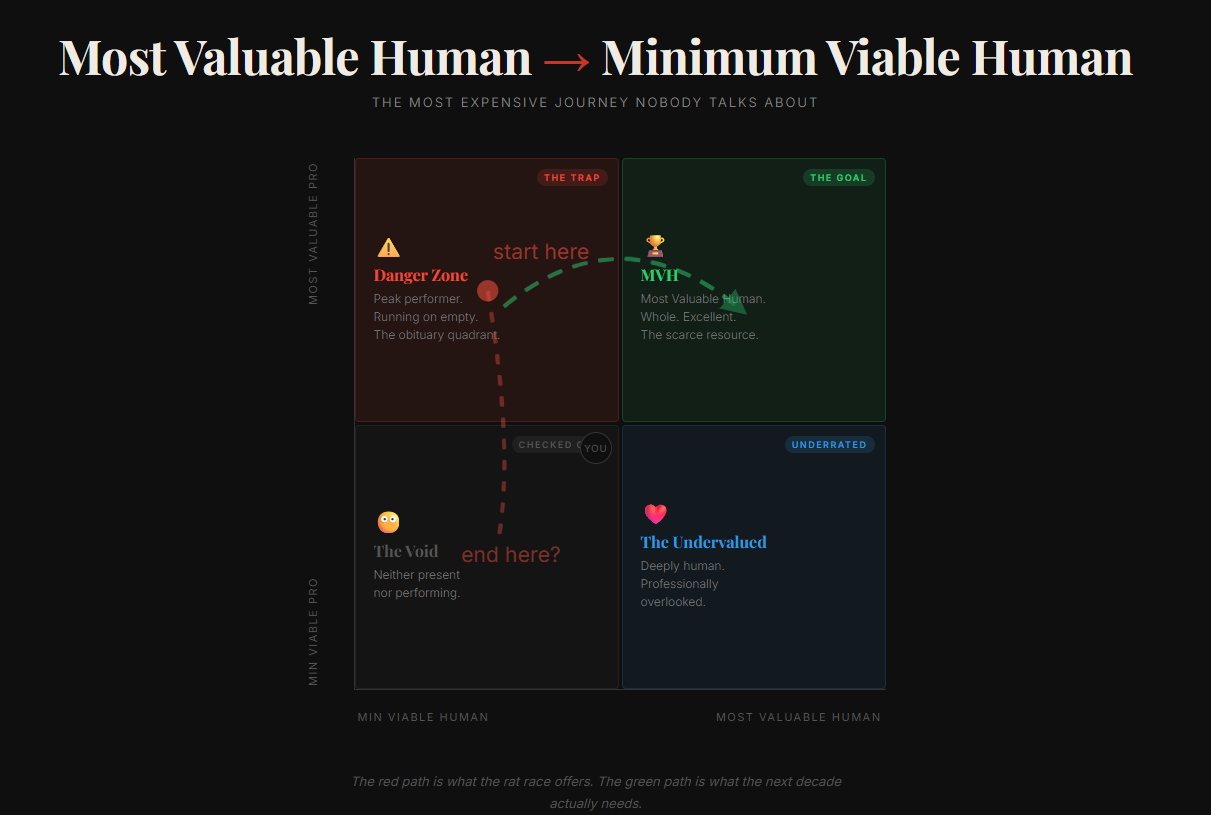
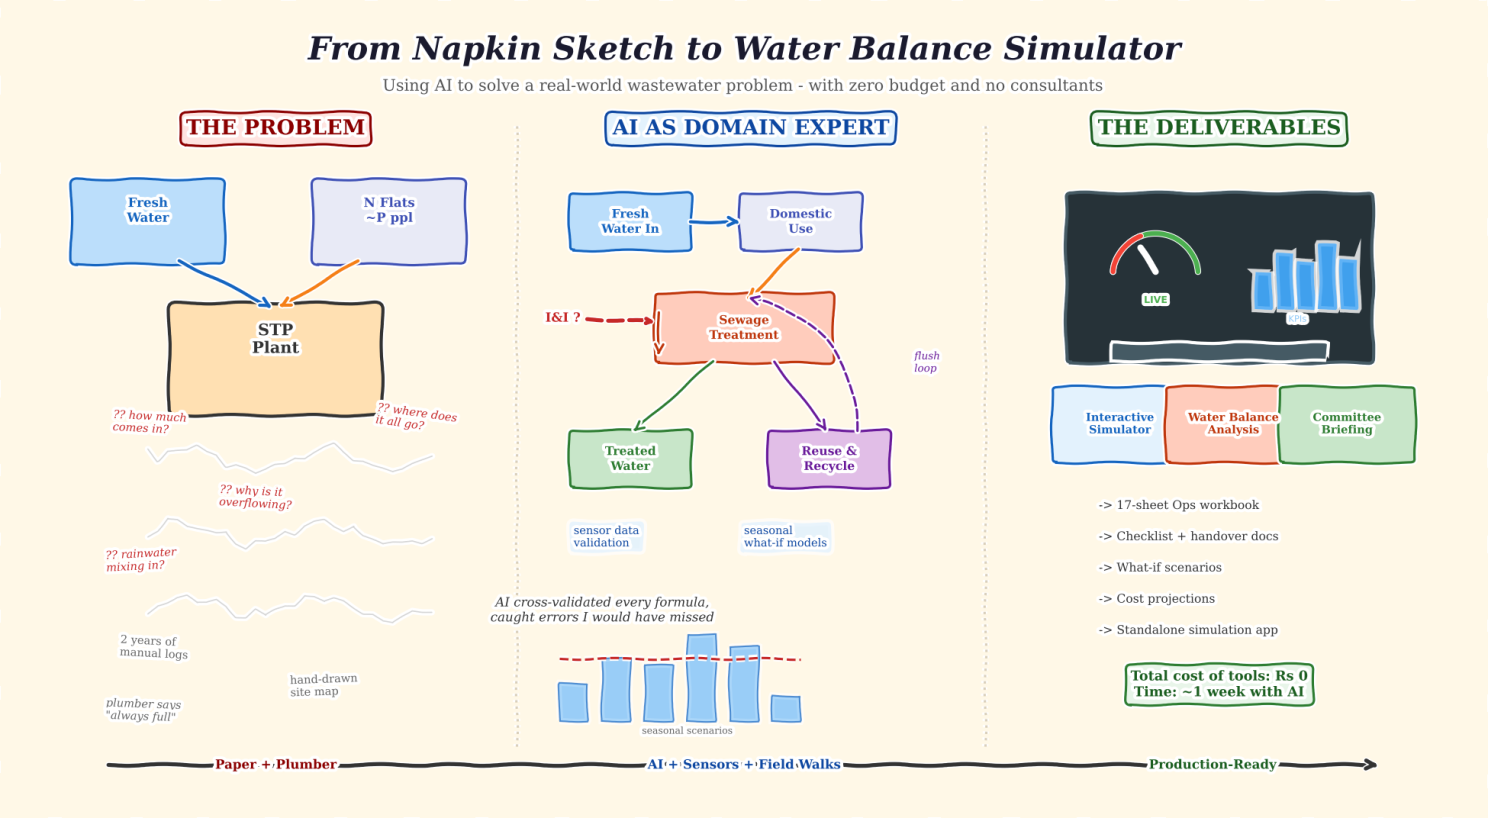
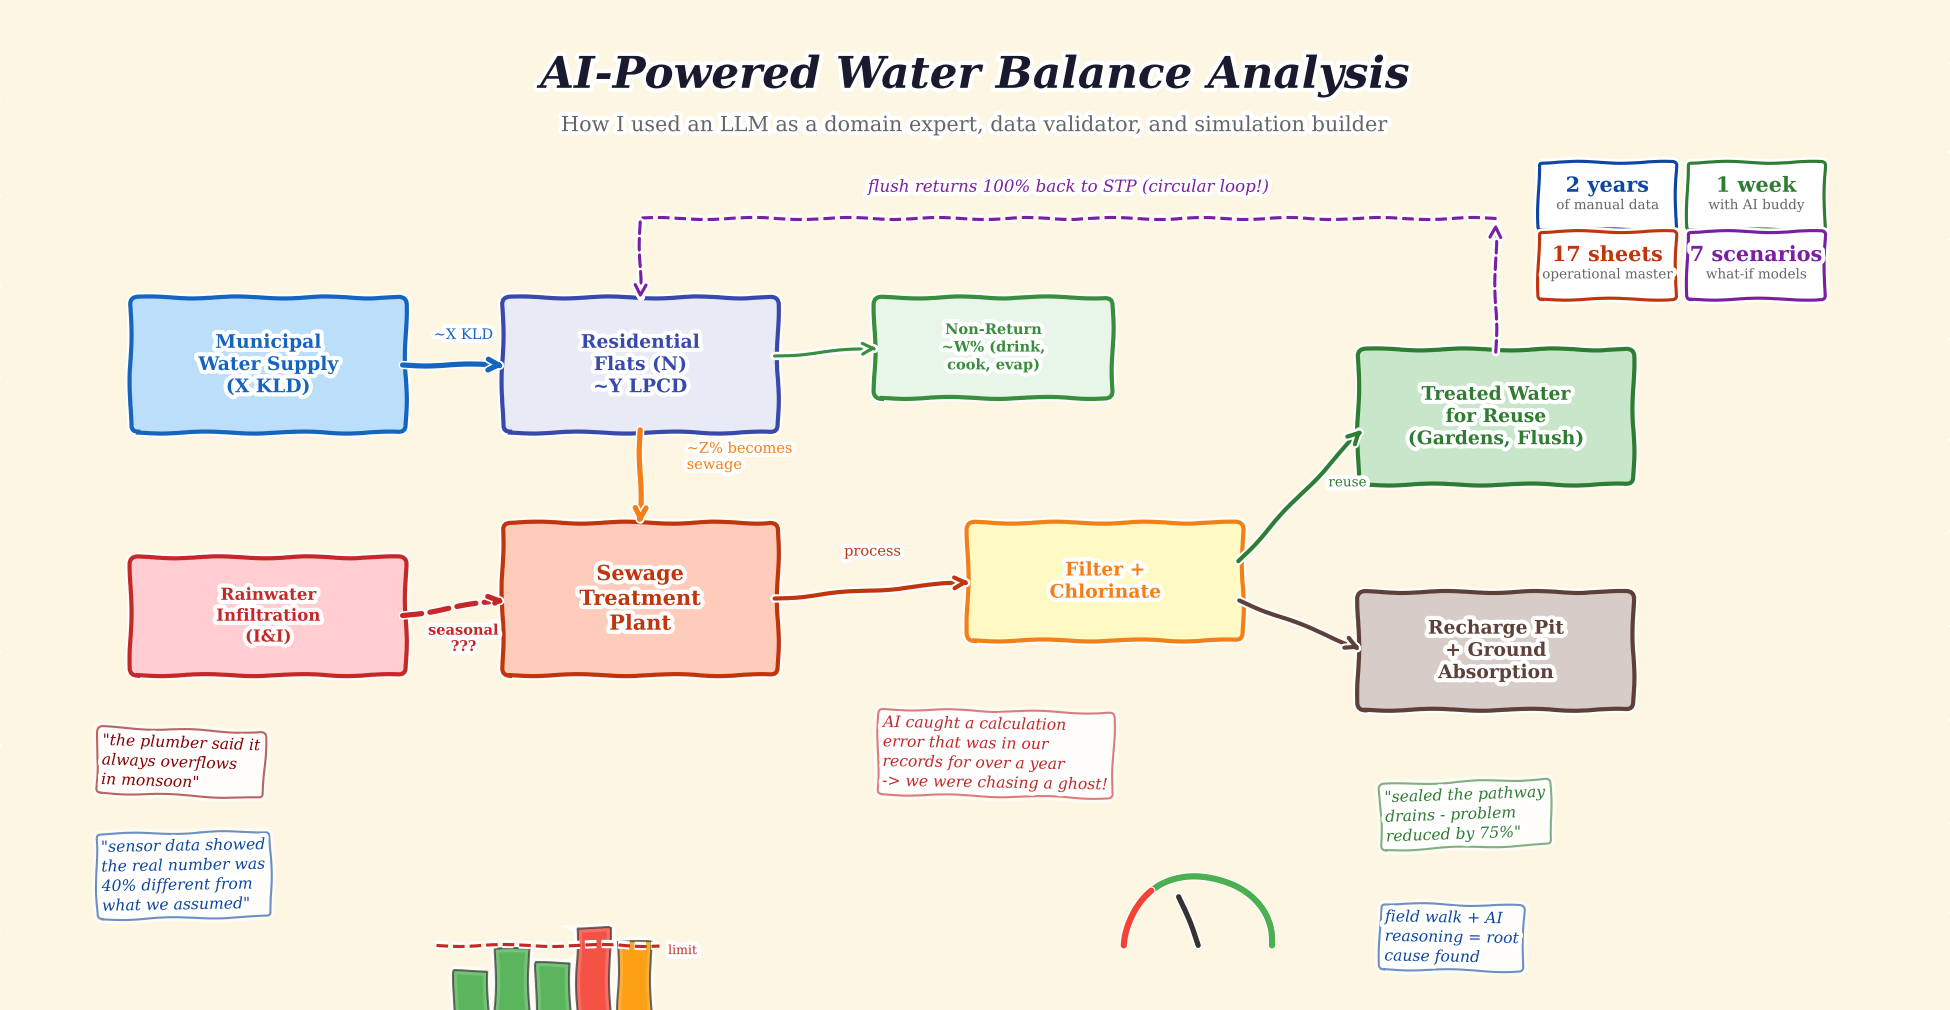
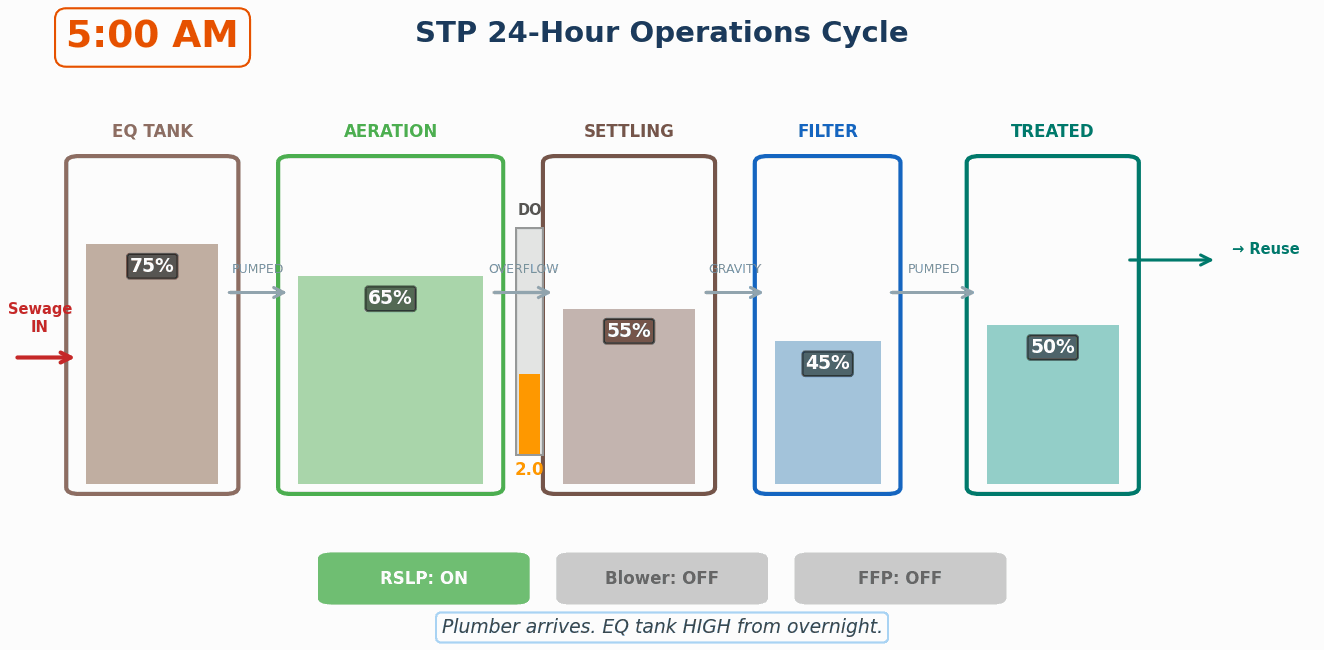
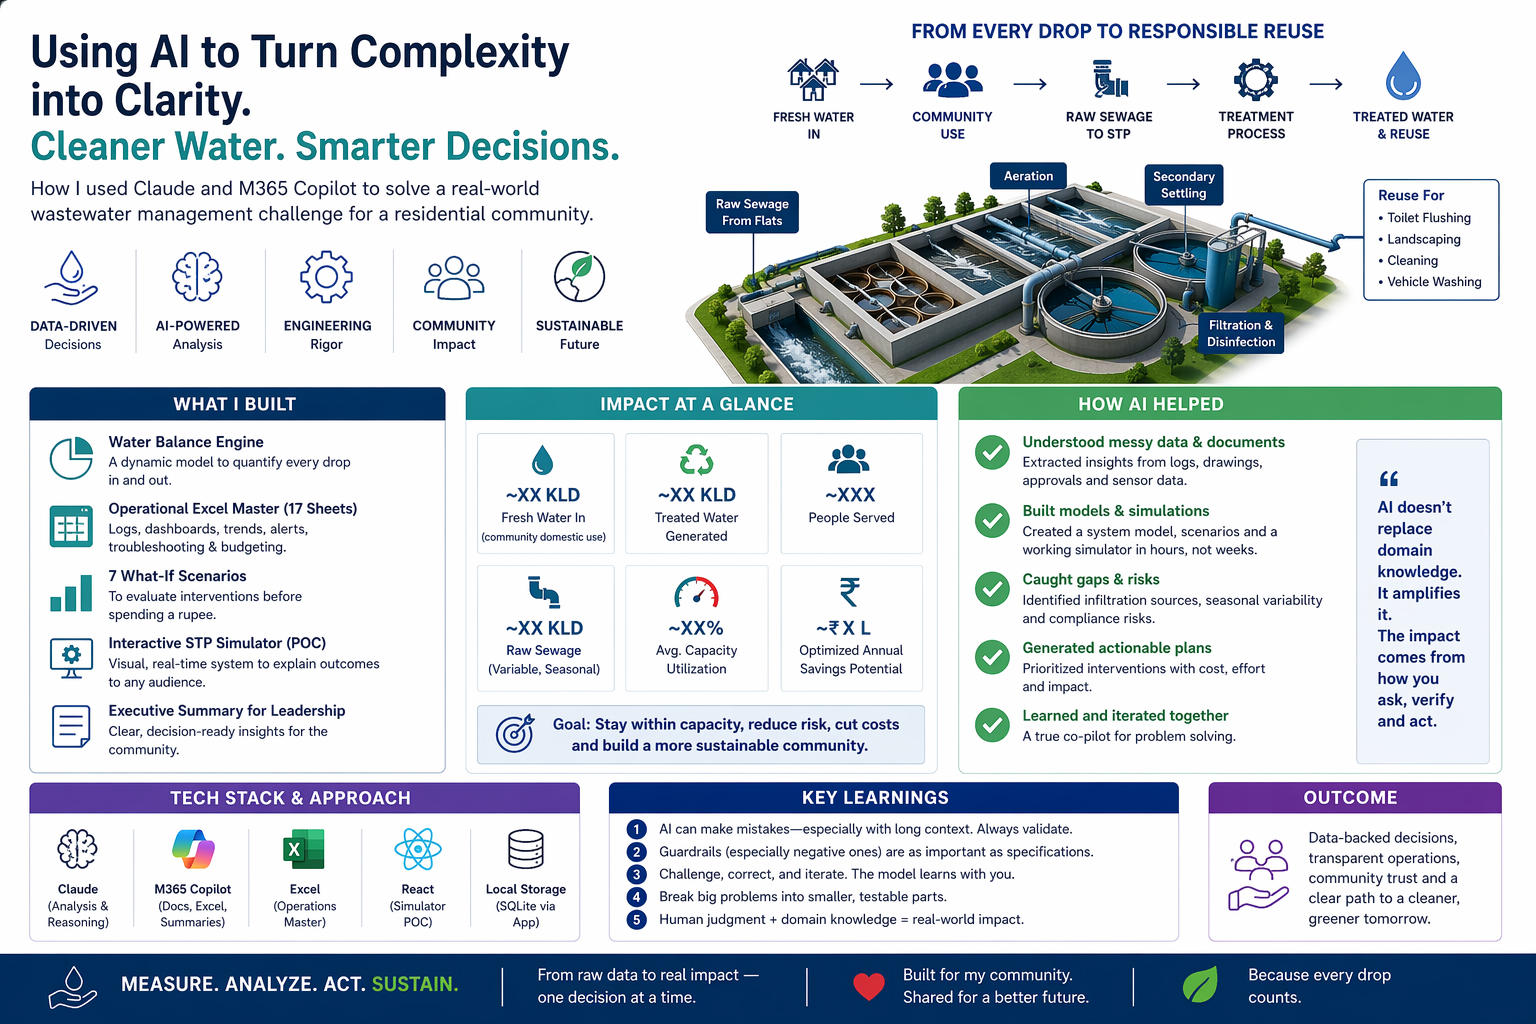


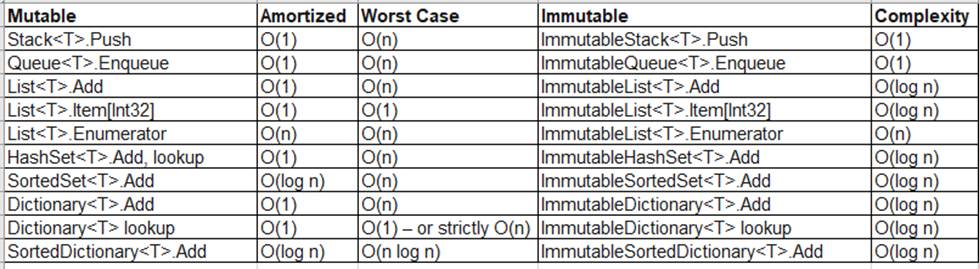

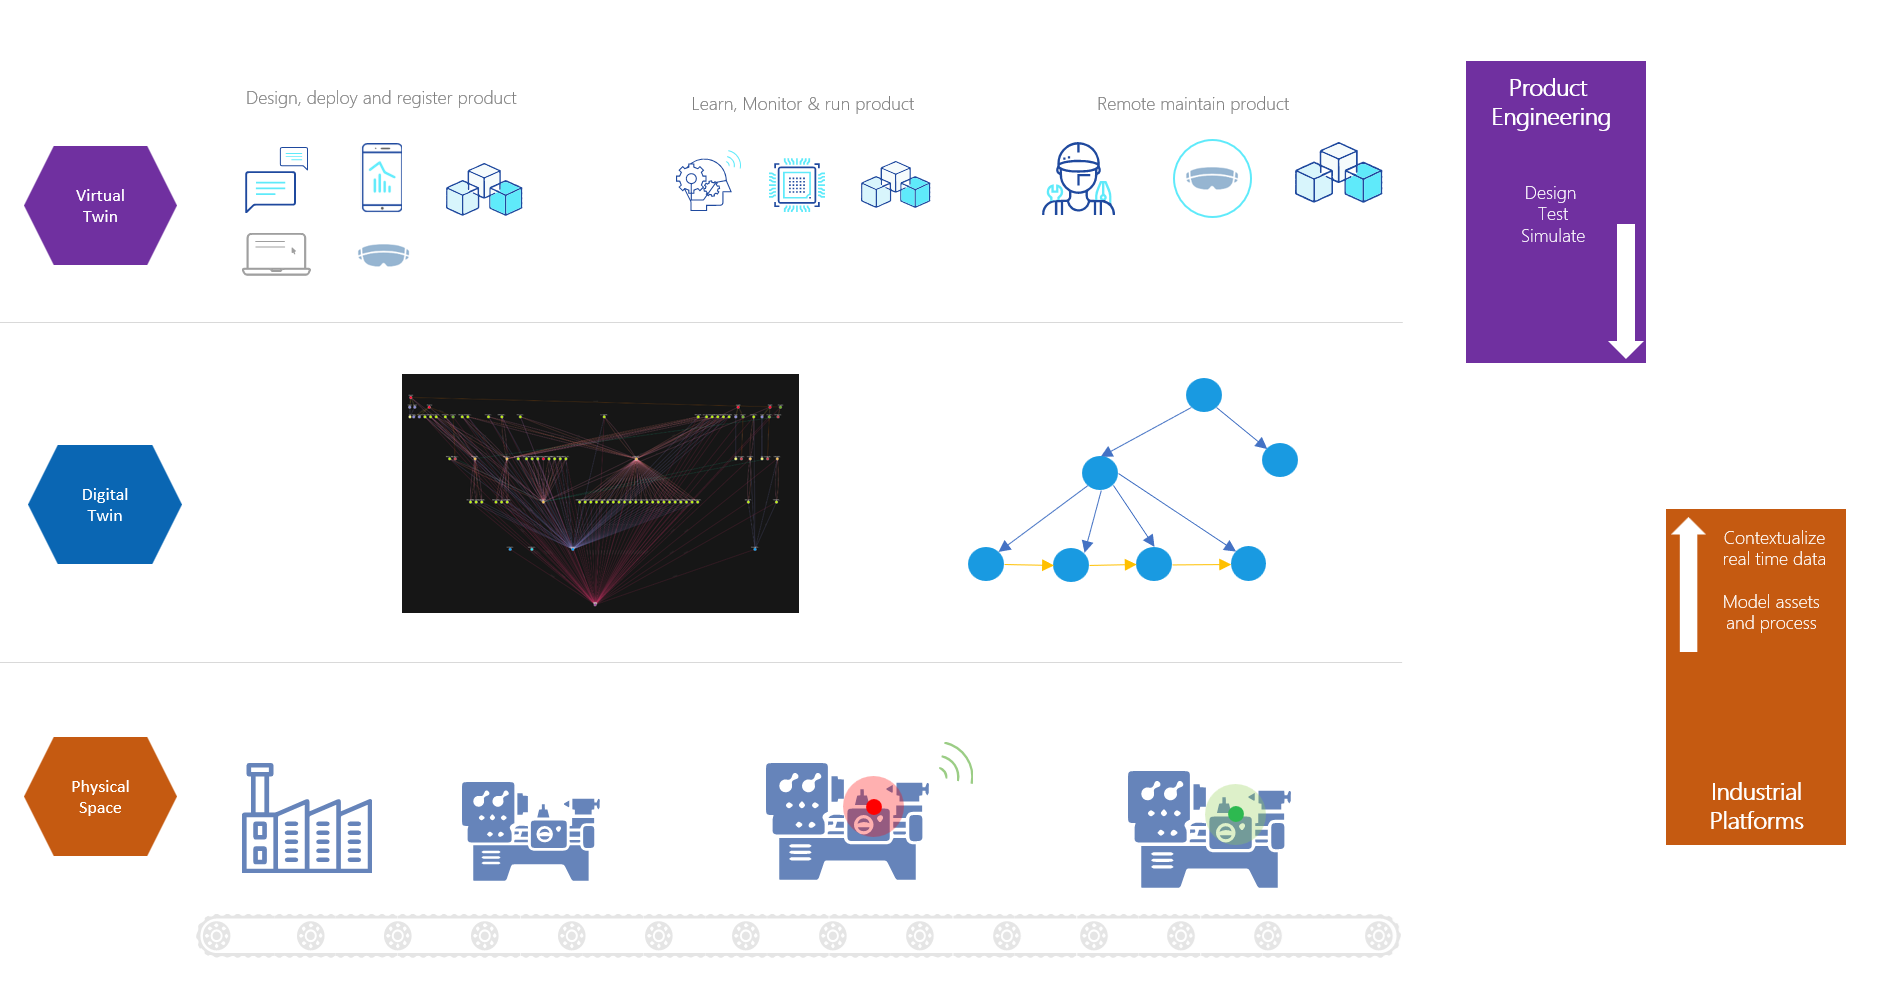
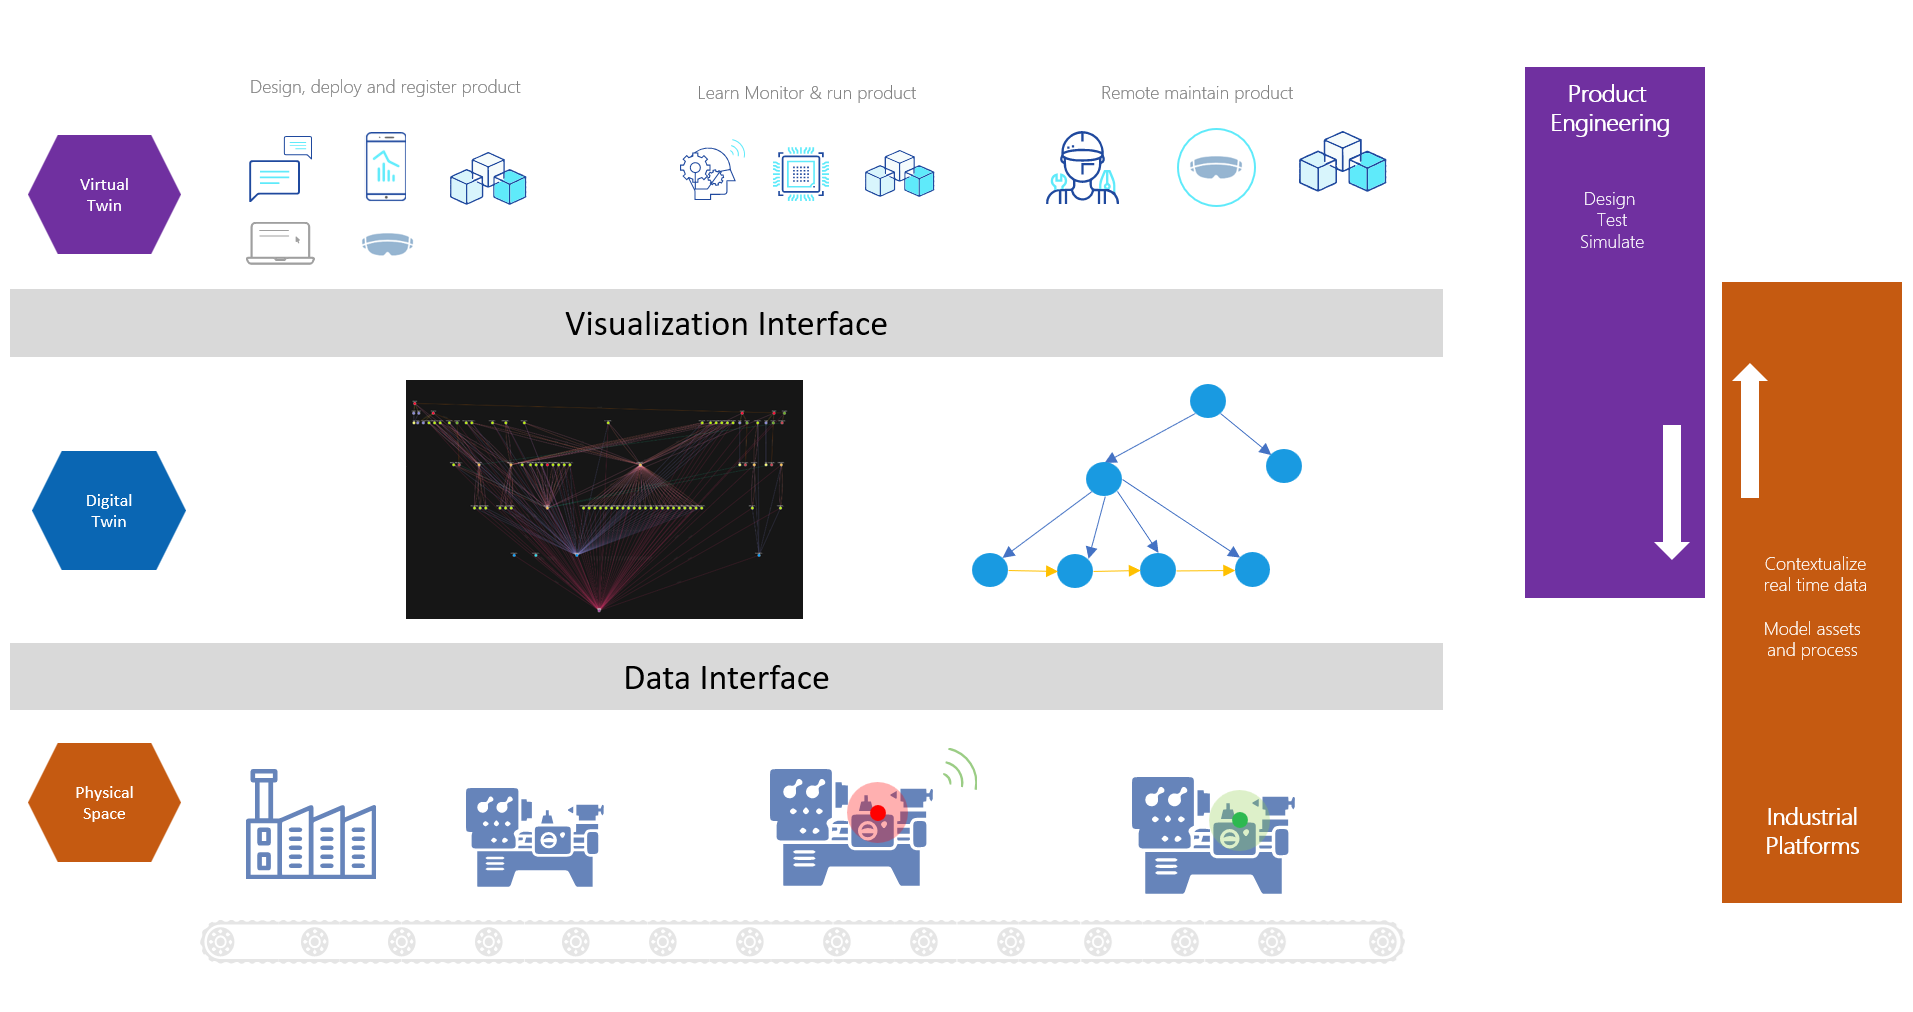


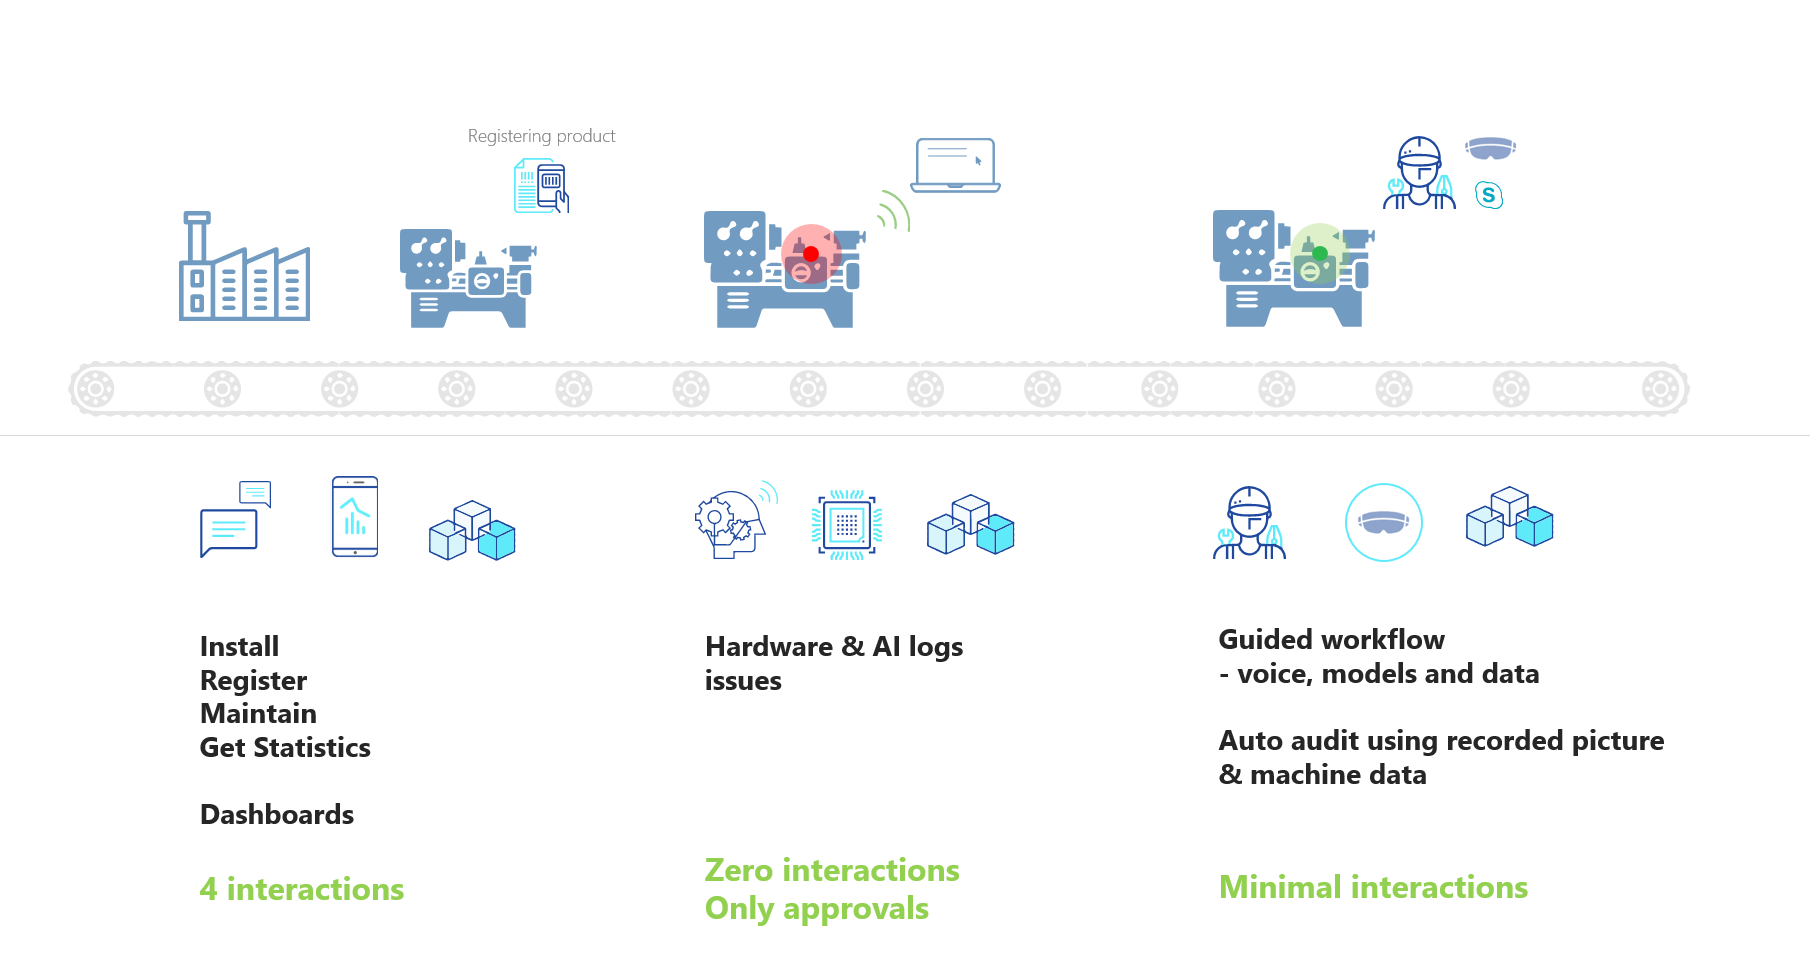

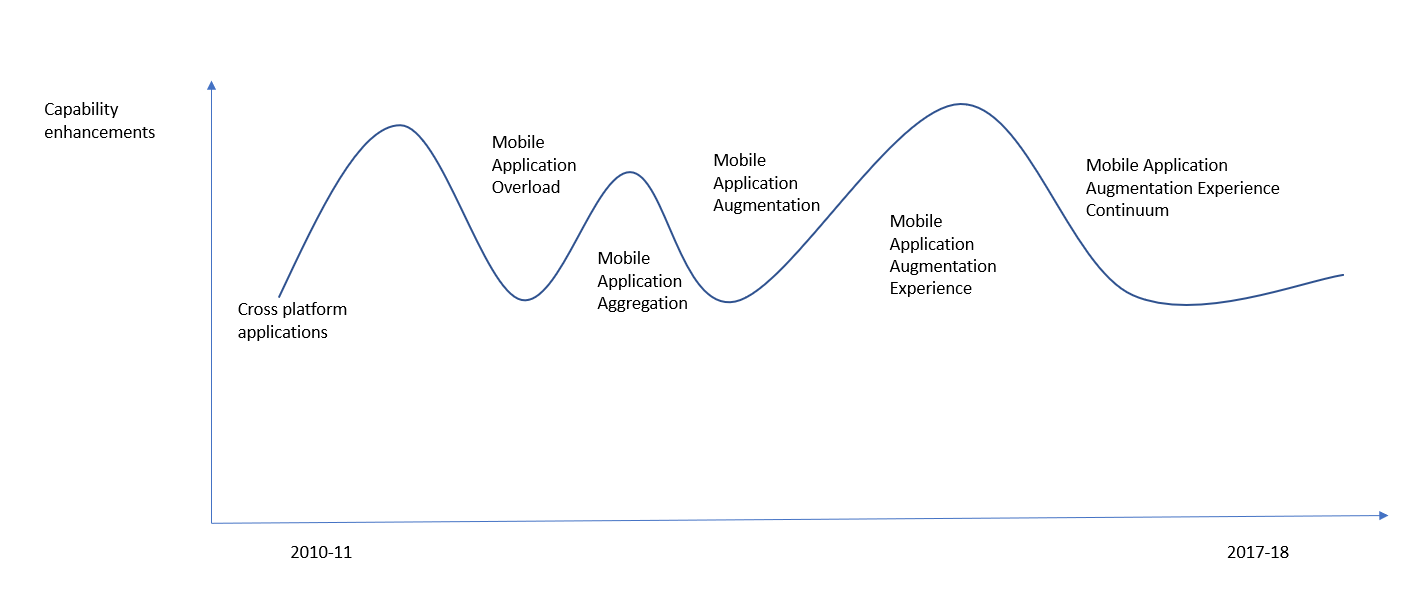
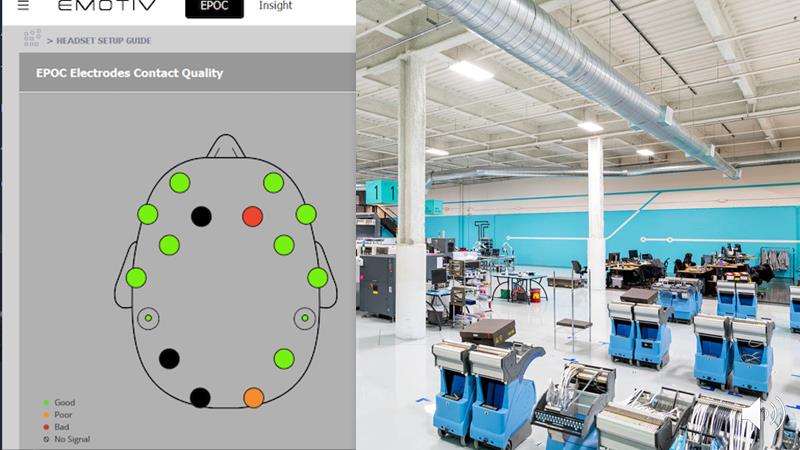
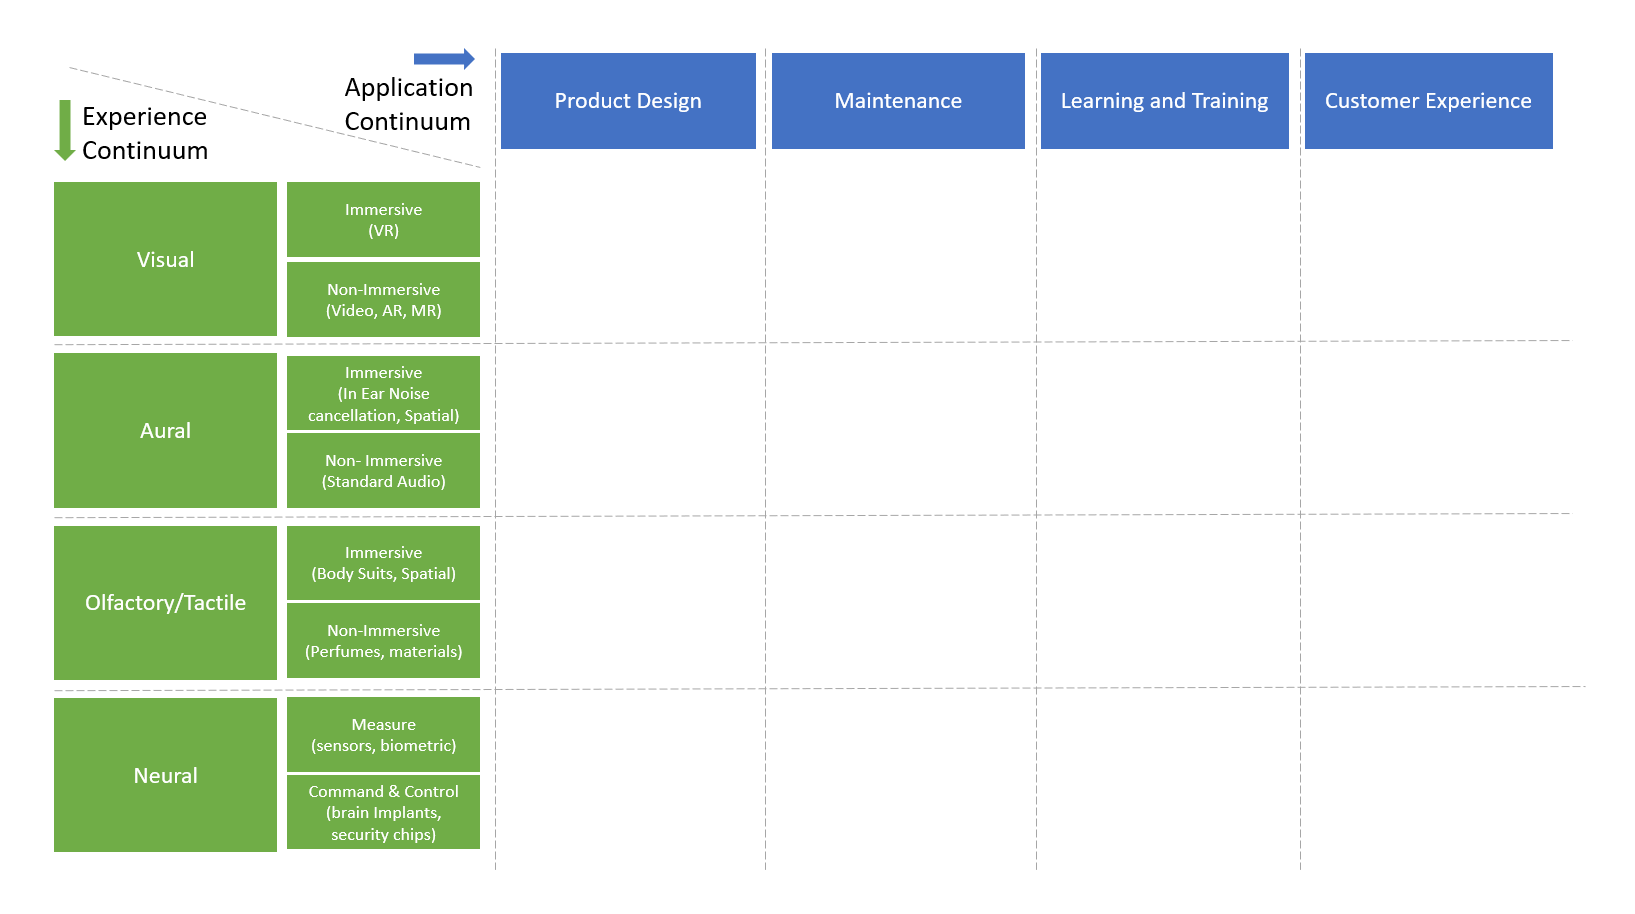
![e-Health Sensor Platform V2.0 for Arduino and Raspberry Pi [Biometric / Medical Applications]](https://www.cooking-hacks.com/media/cooking/images/documentation/e_health_v2/e_health_sensors_small.png)


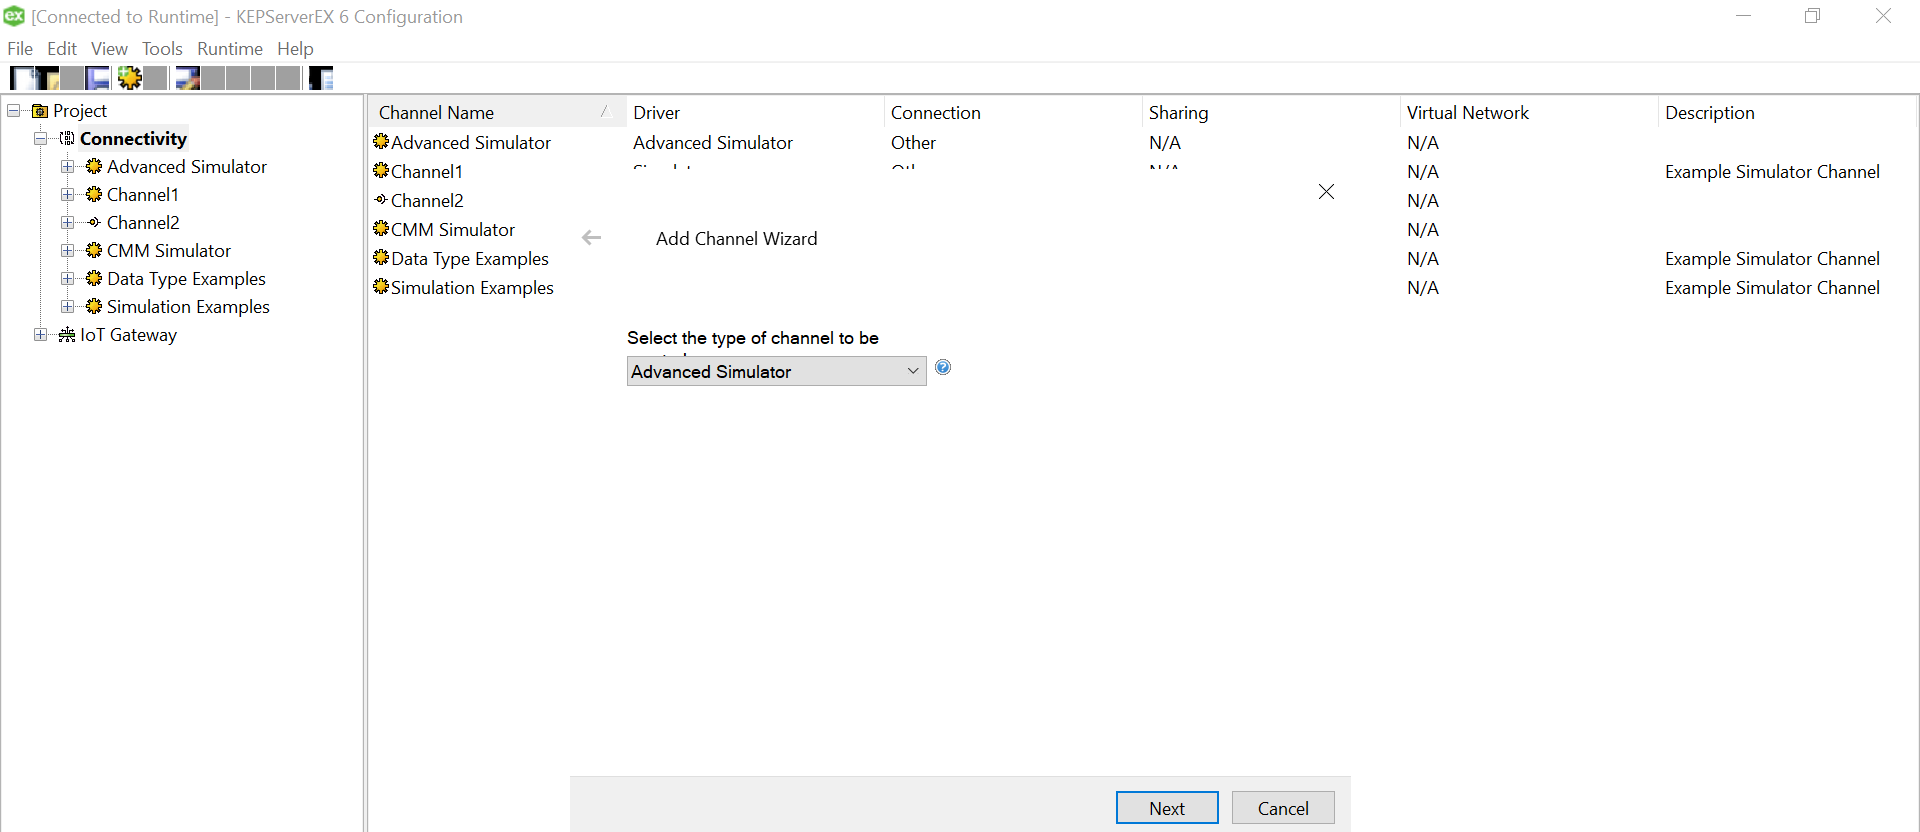
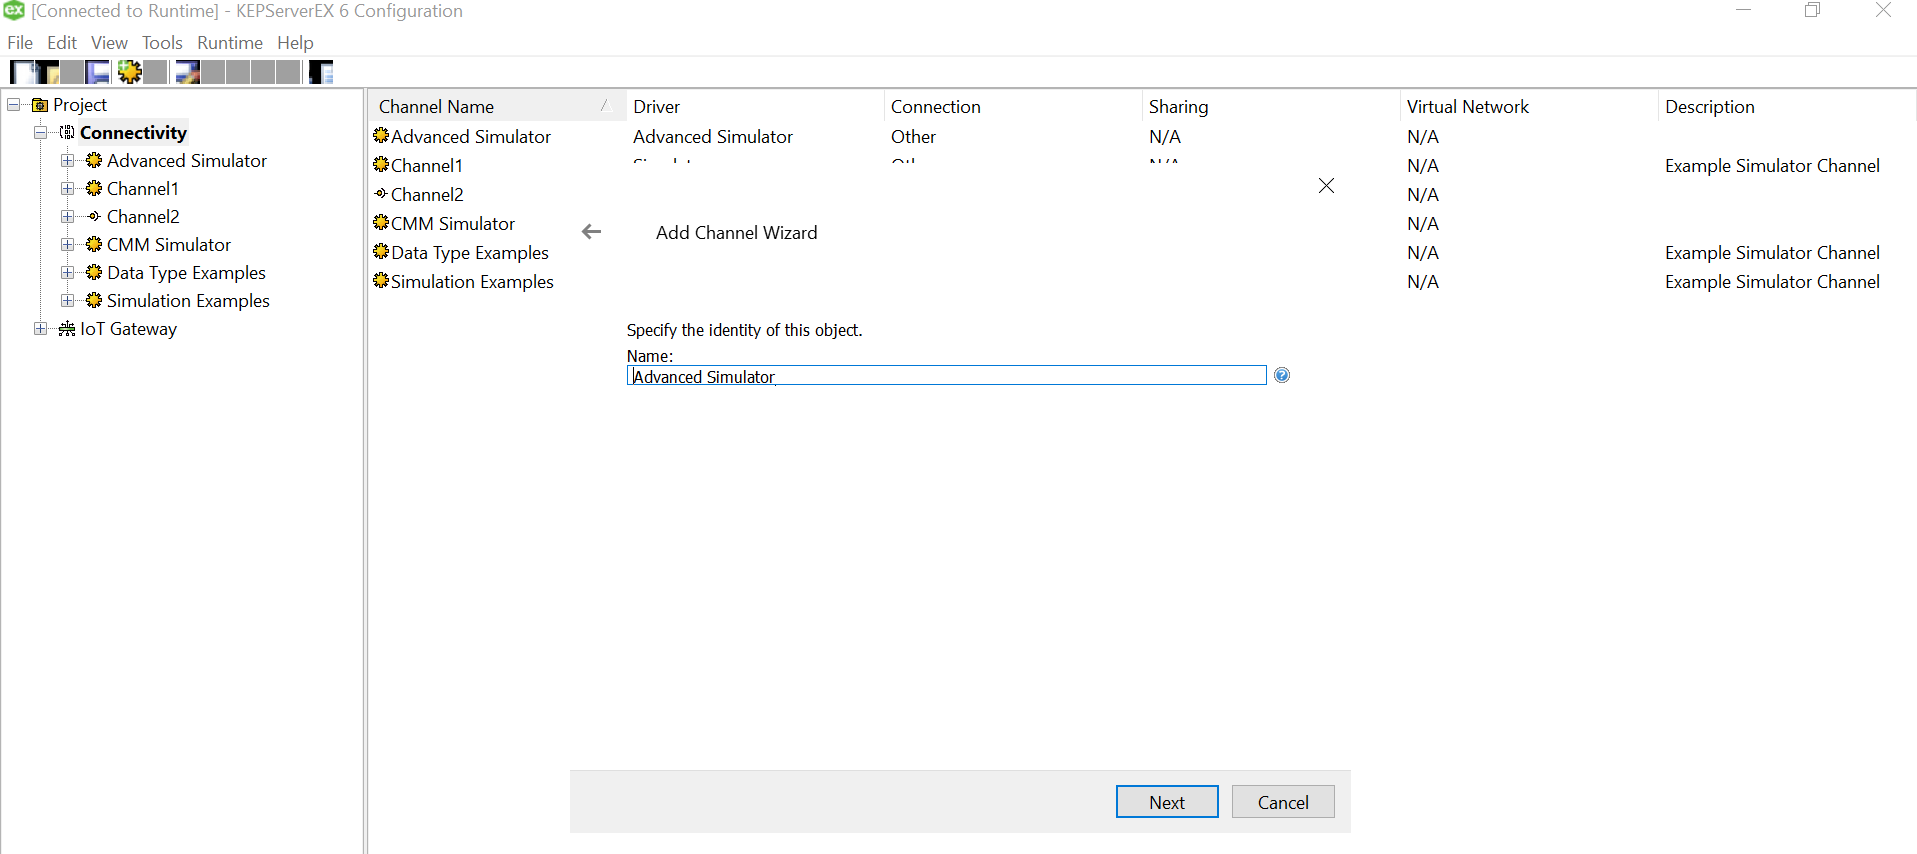
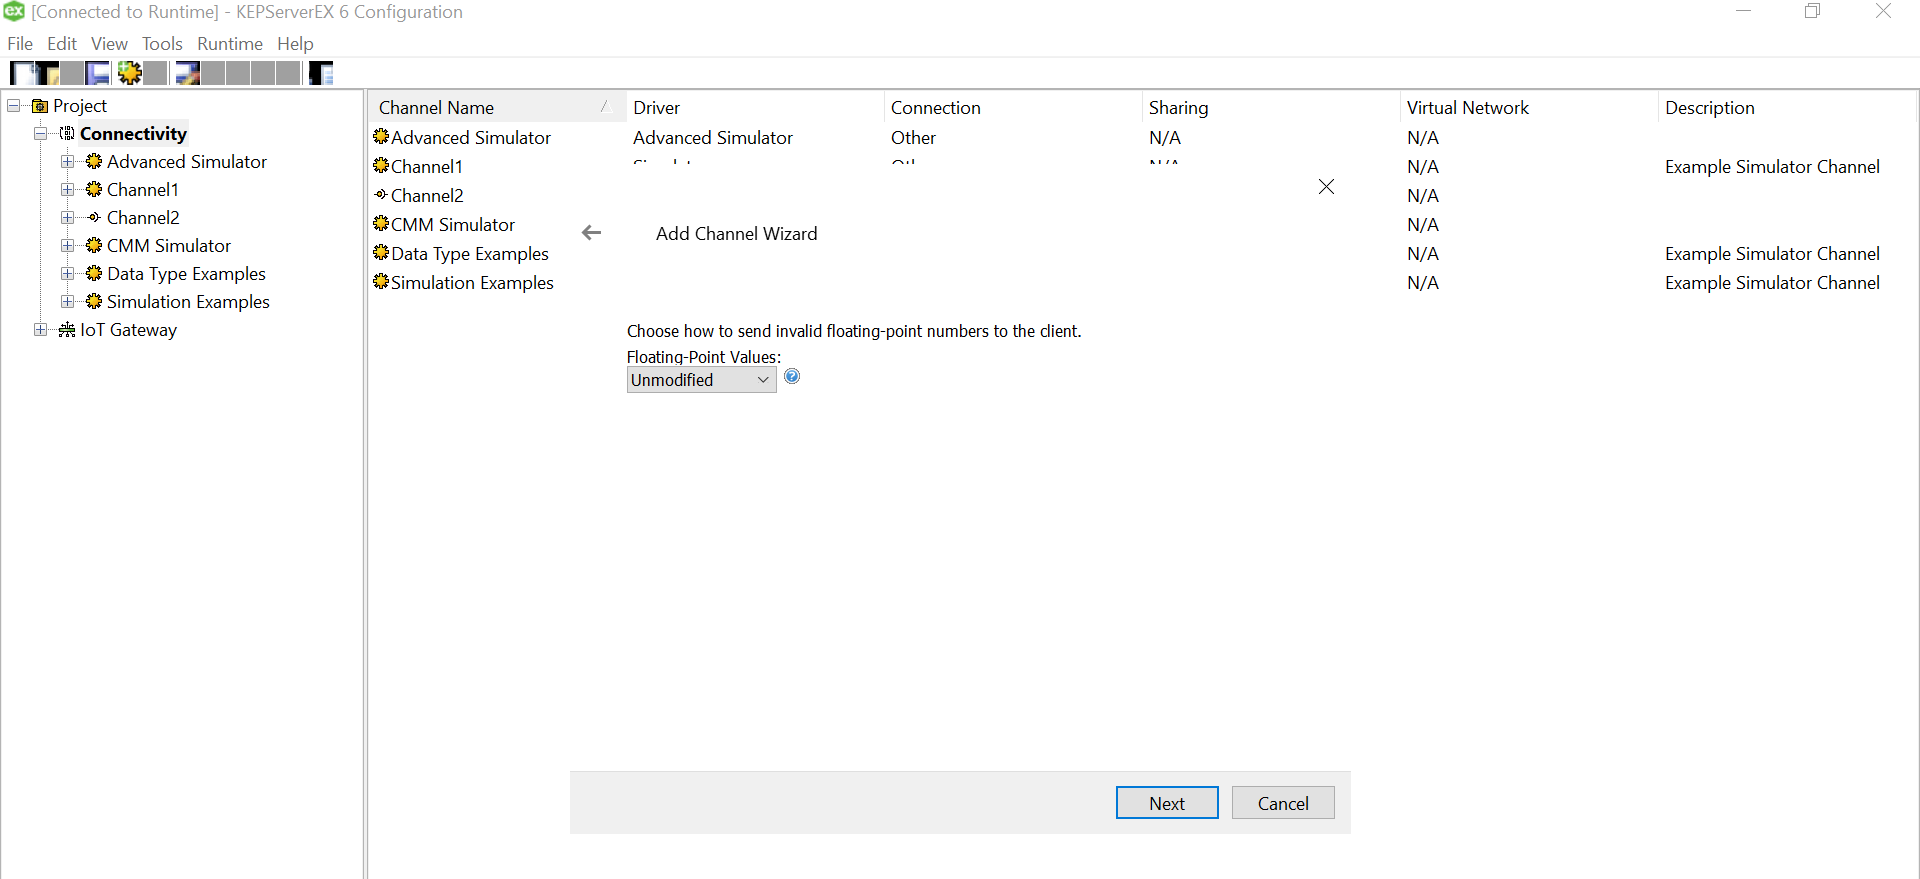

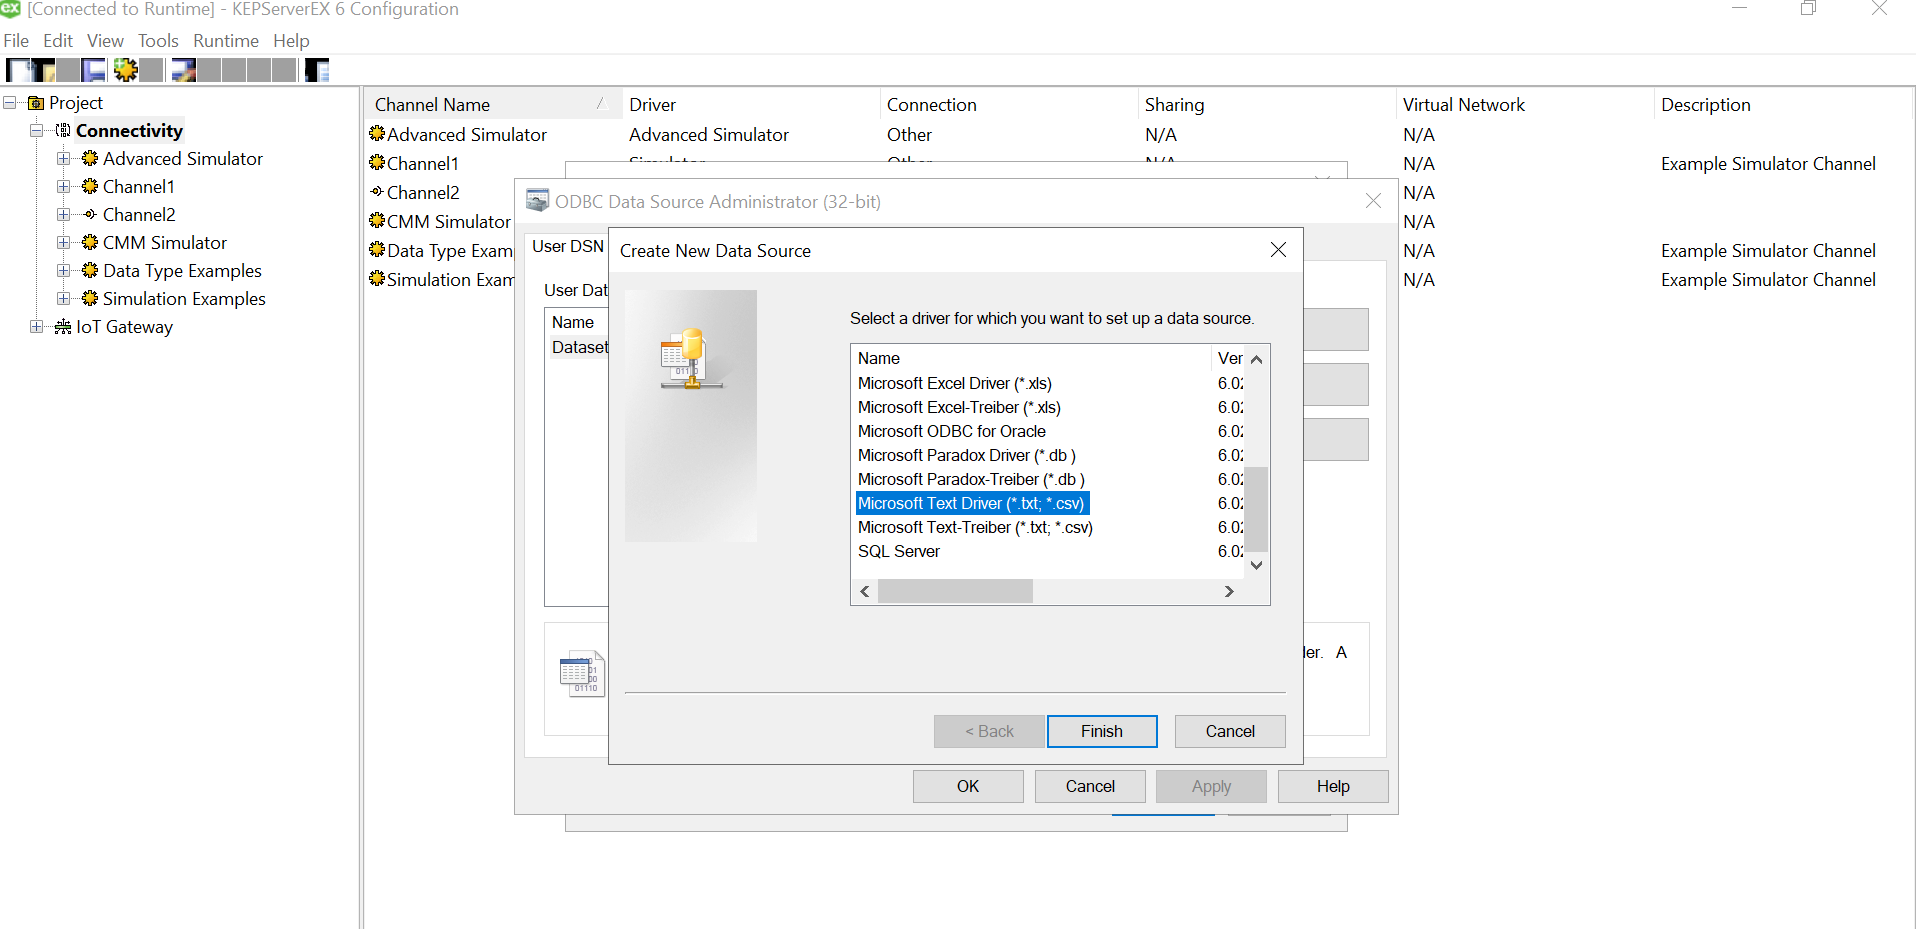
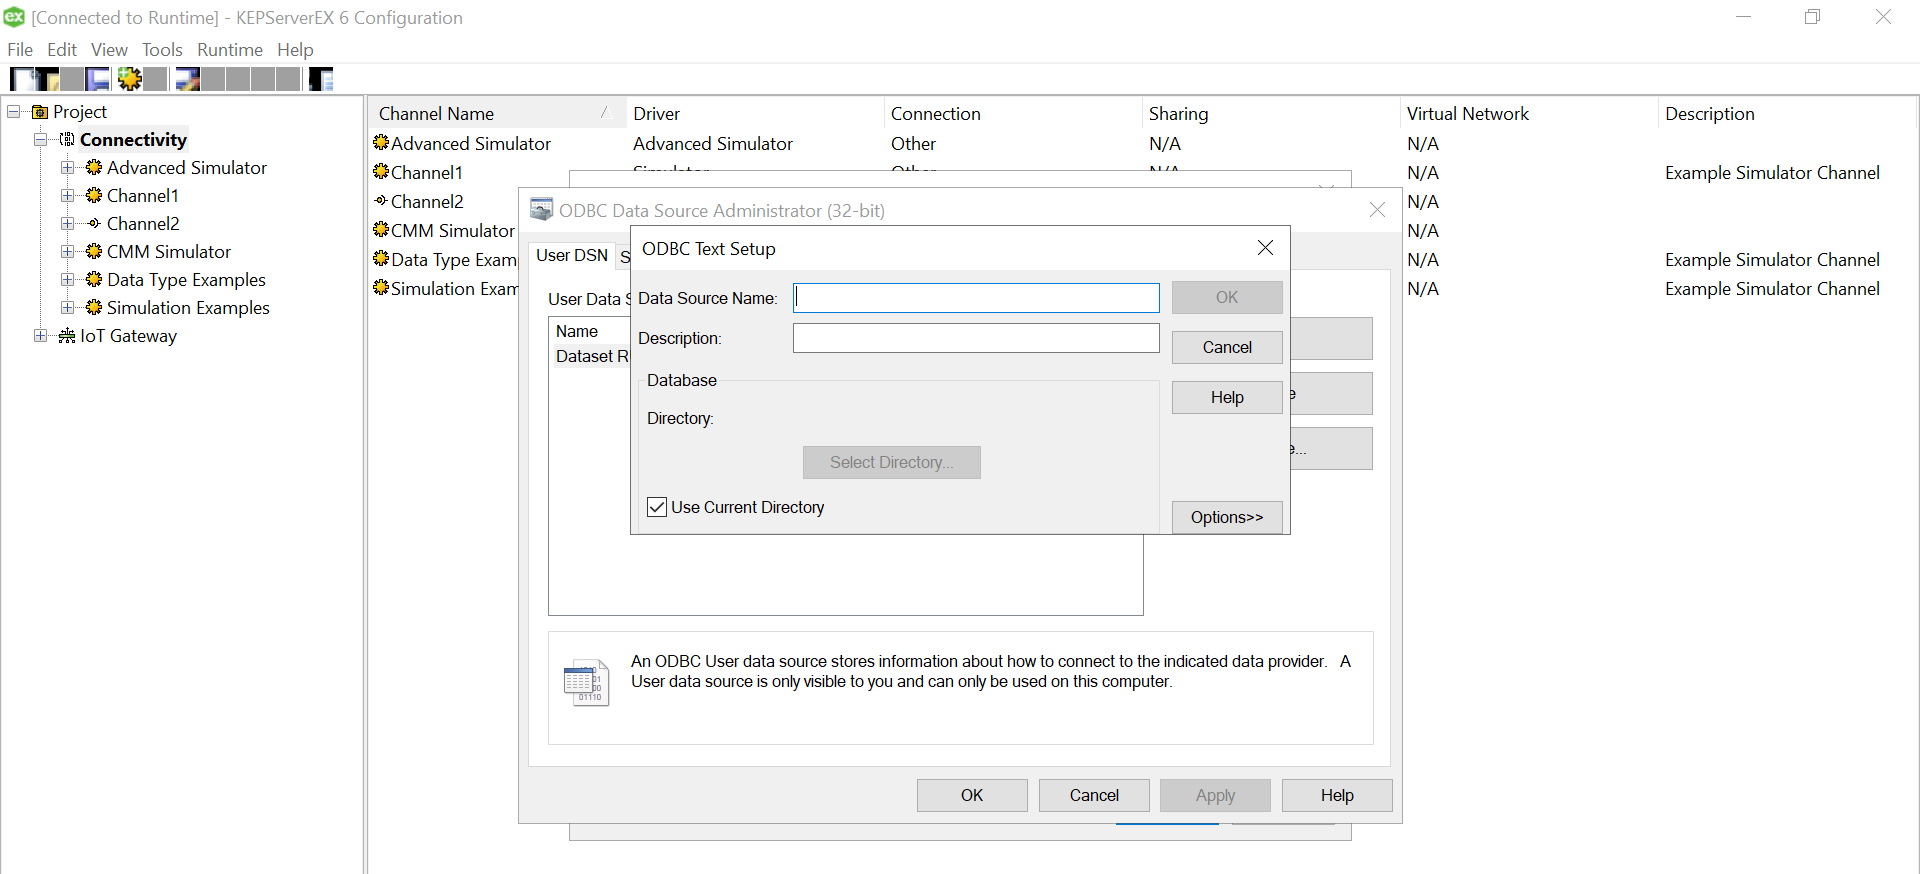 Use “Define Format” feature to select the columns and guess the tag rows. That will help you know if the file is being read correctly. If there are changes to delimiters and stuff we can give all those customizations here. We had a standard csv.
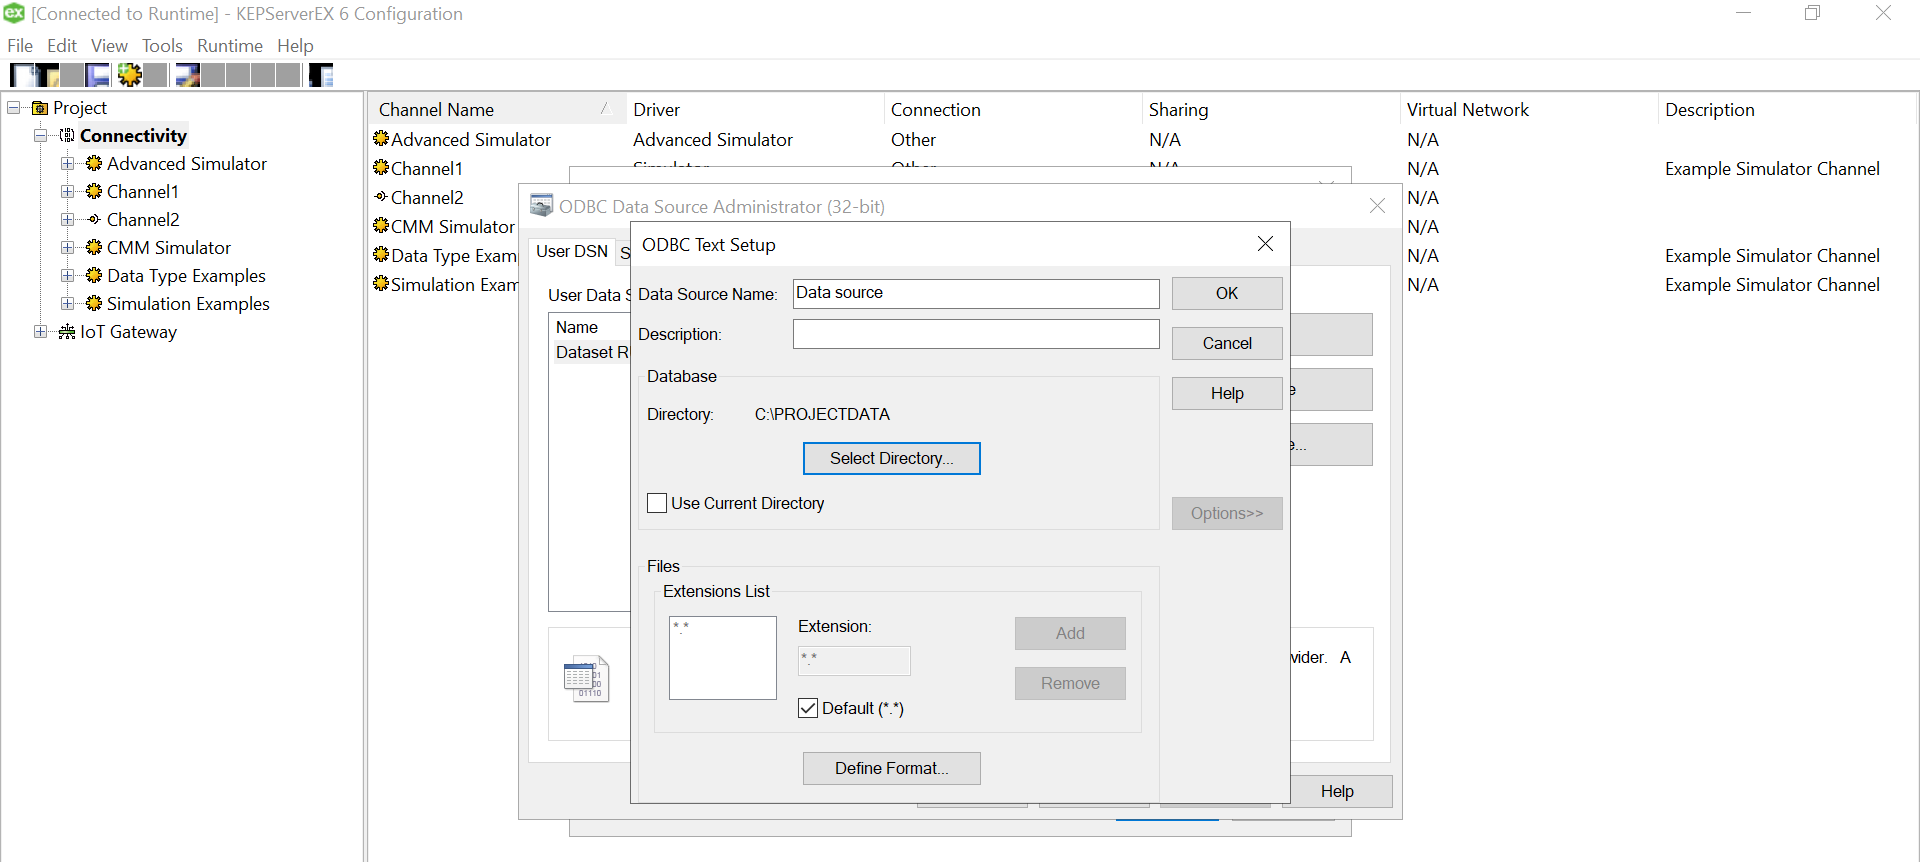
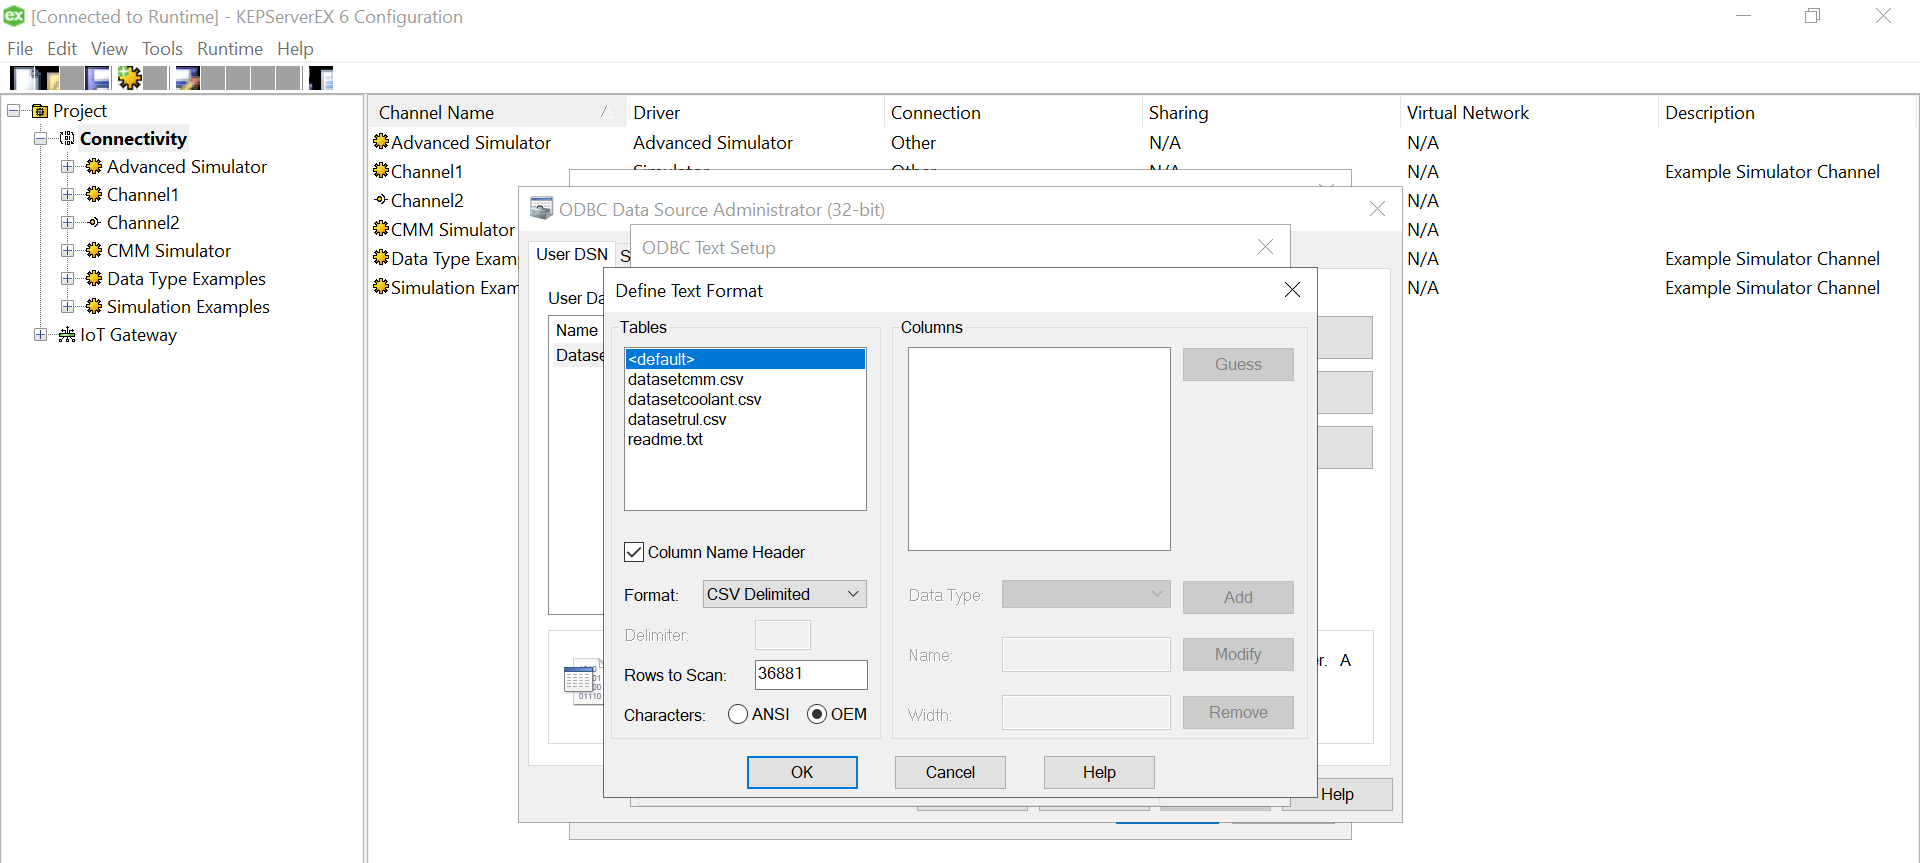
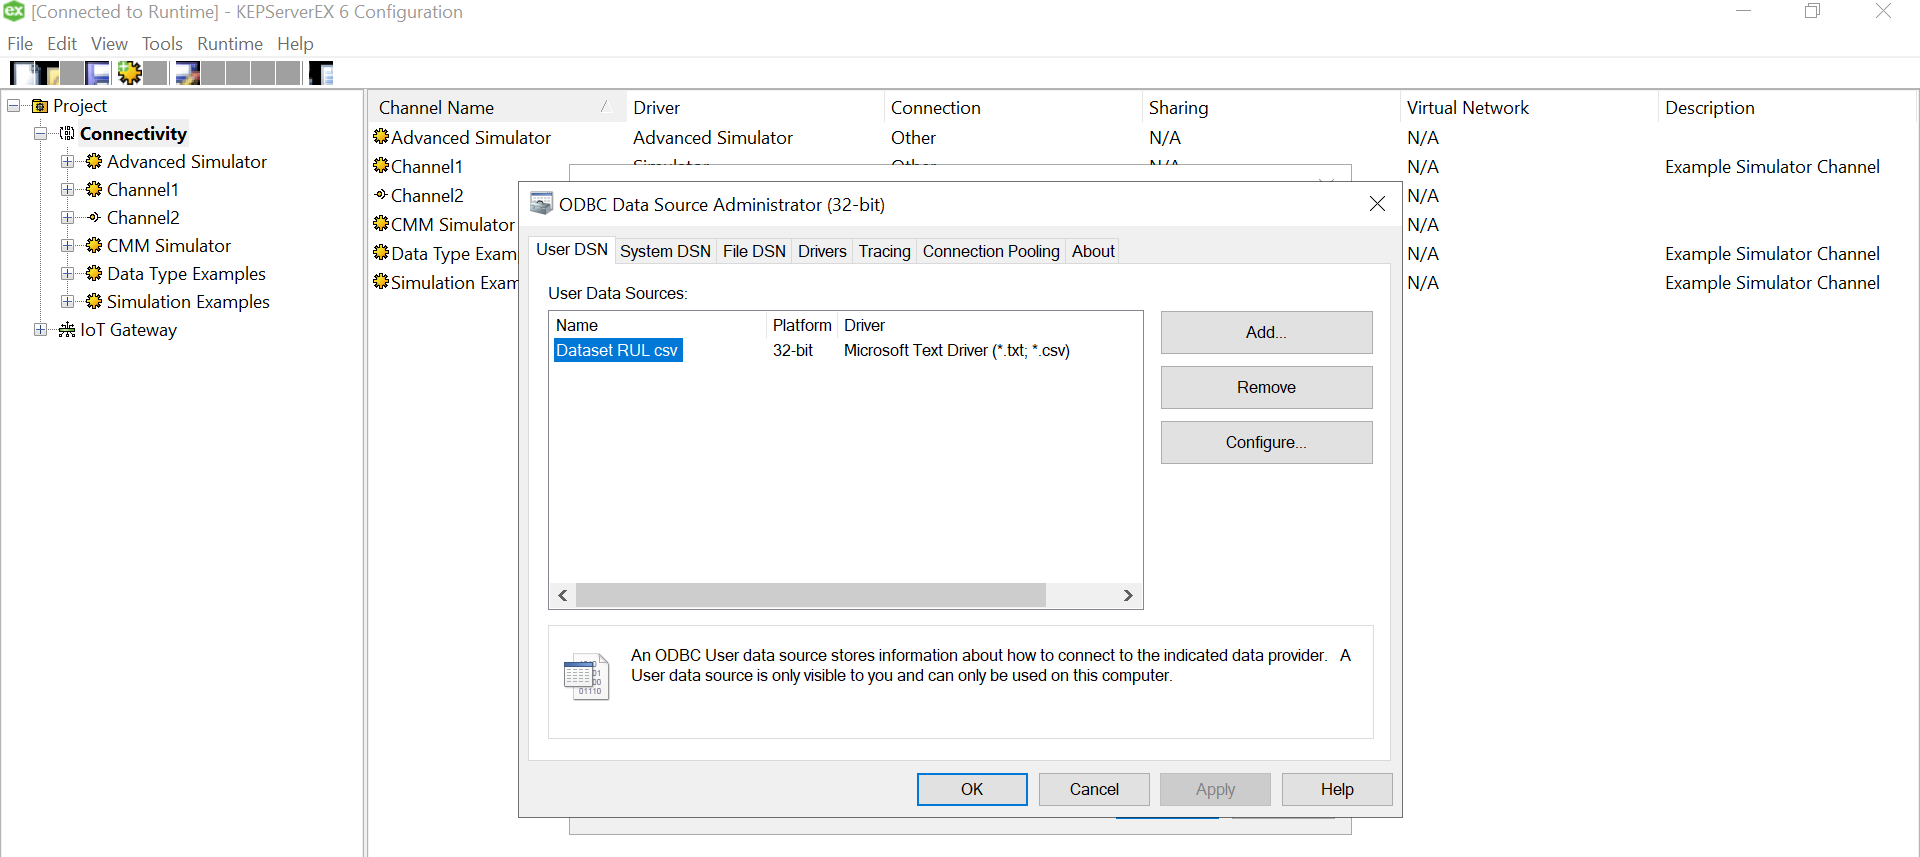
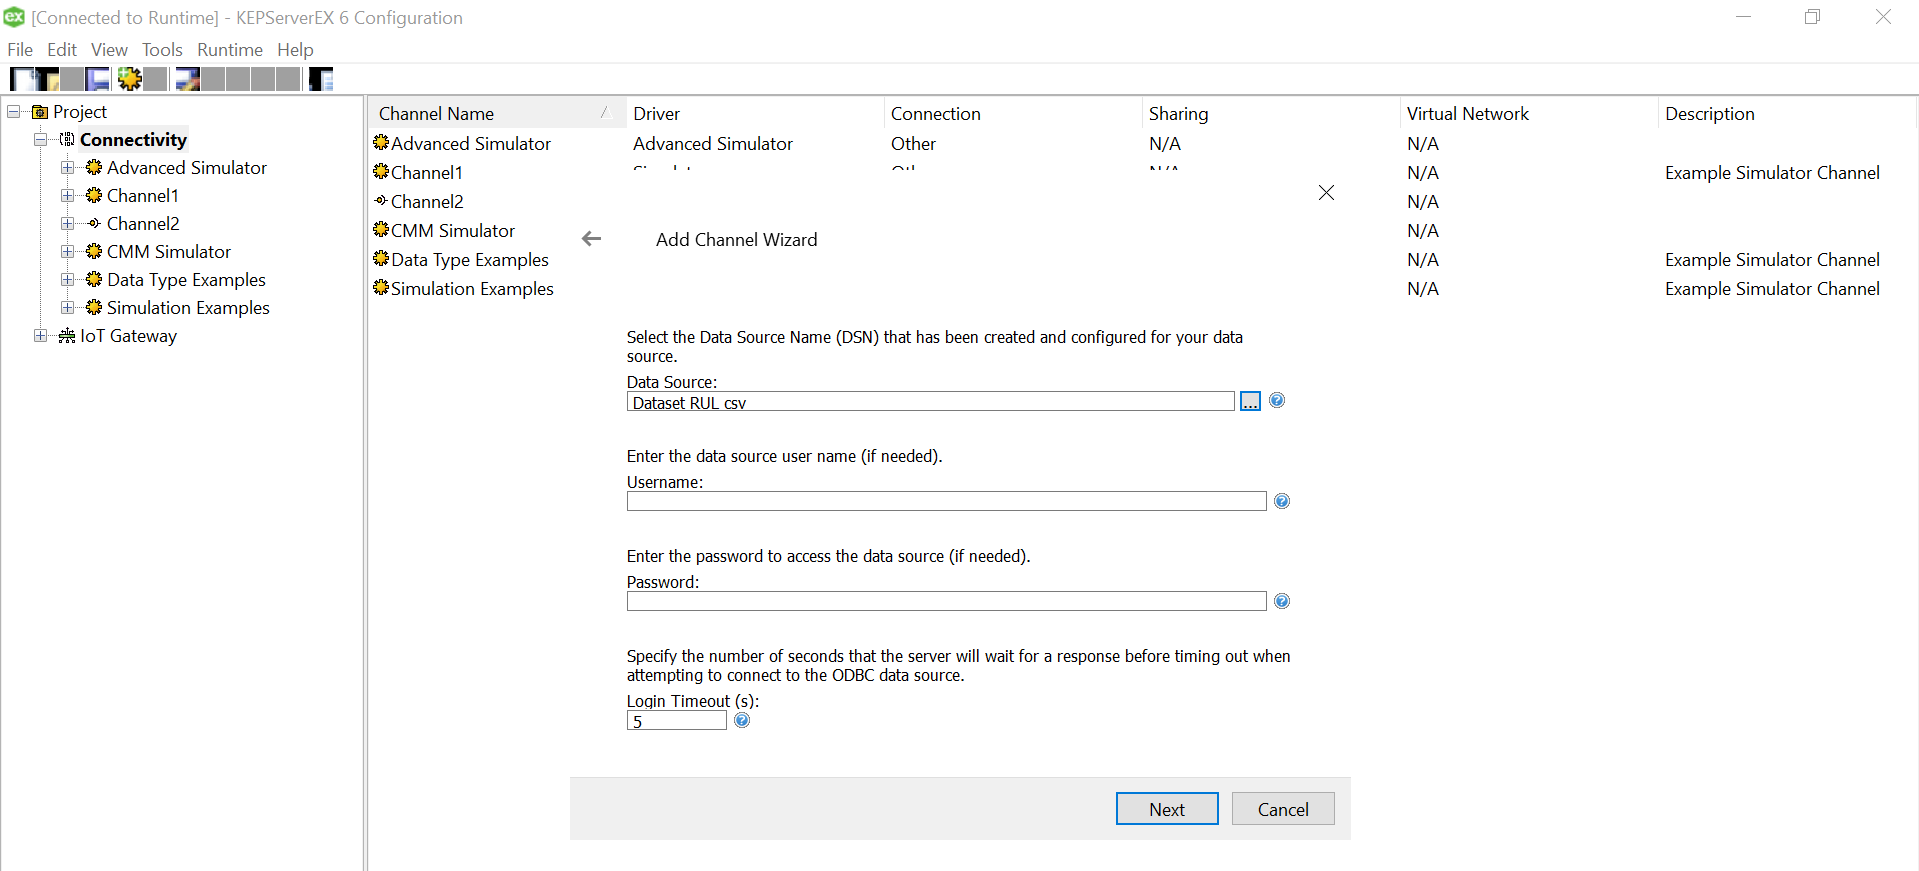
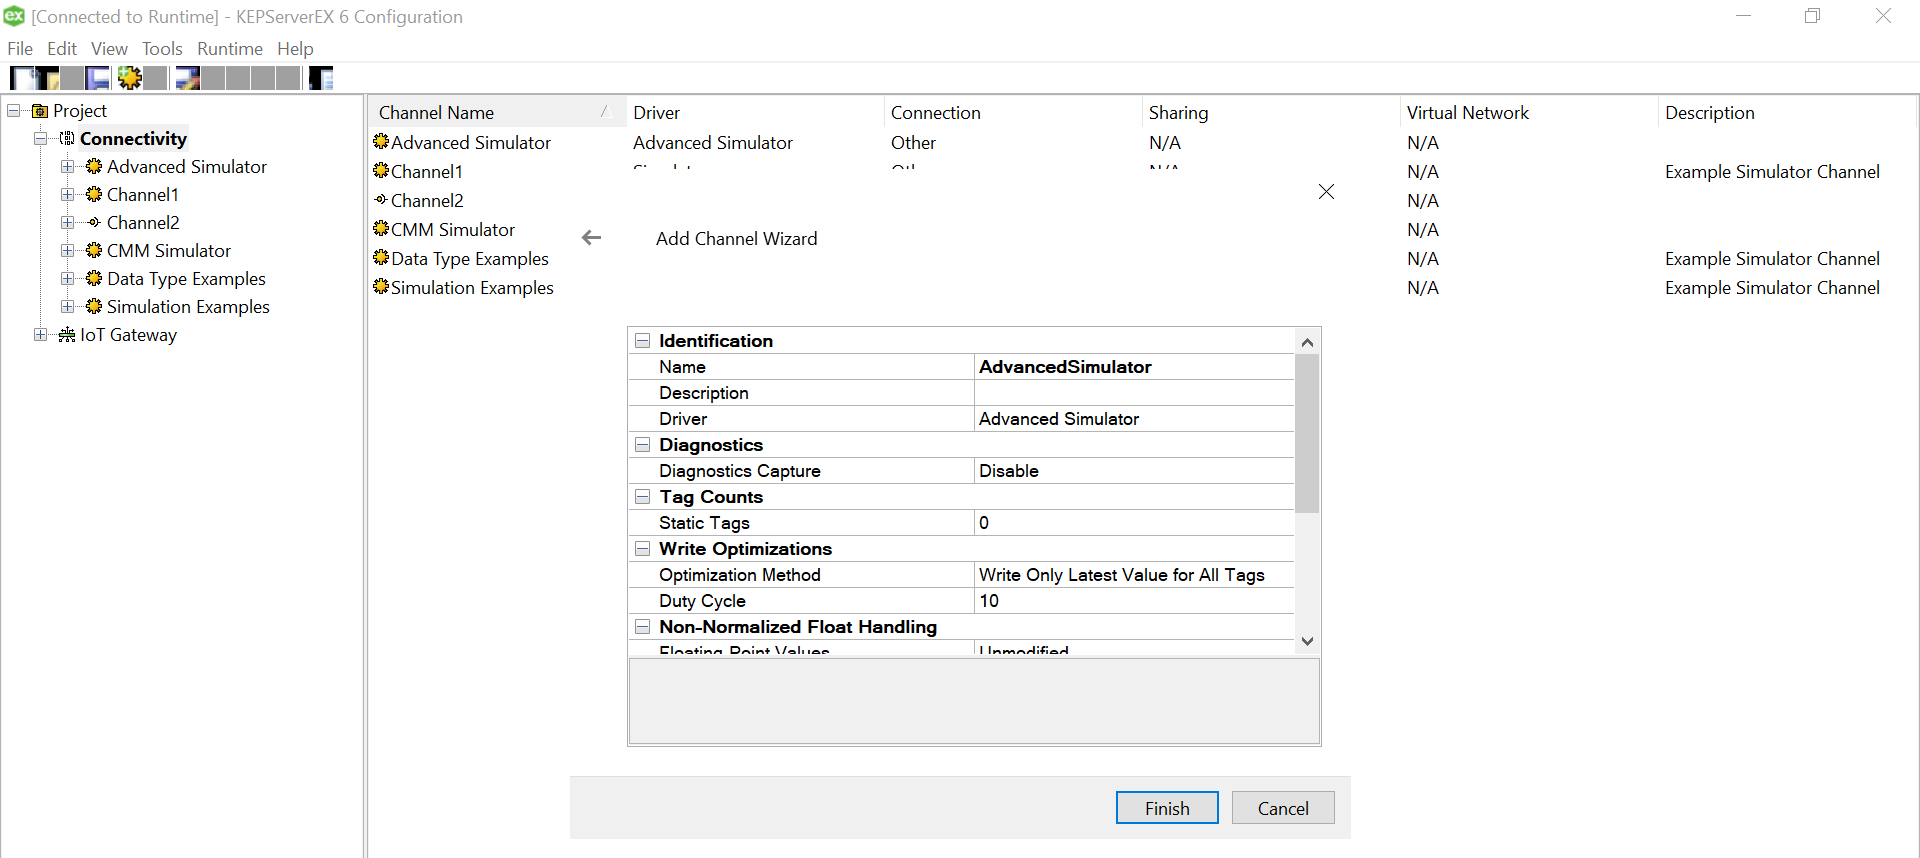
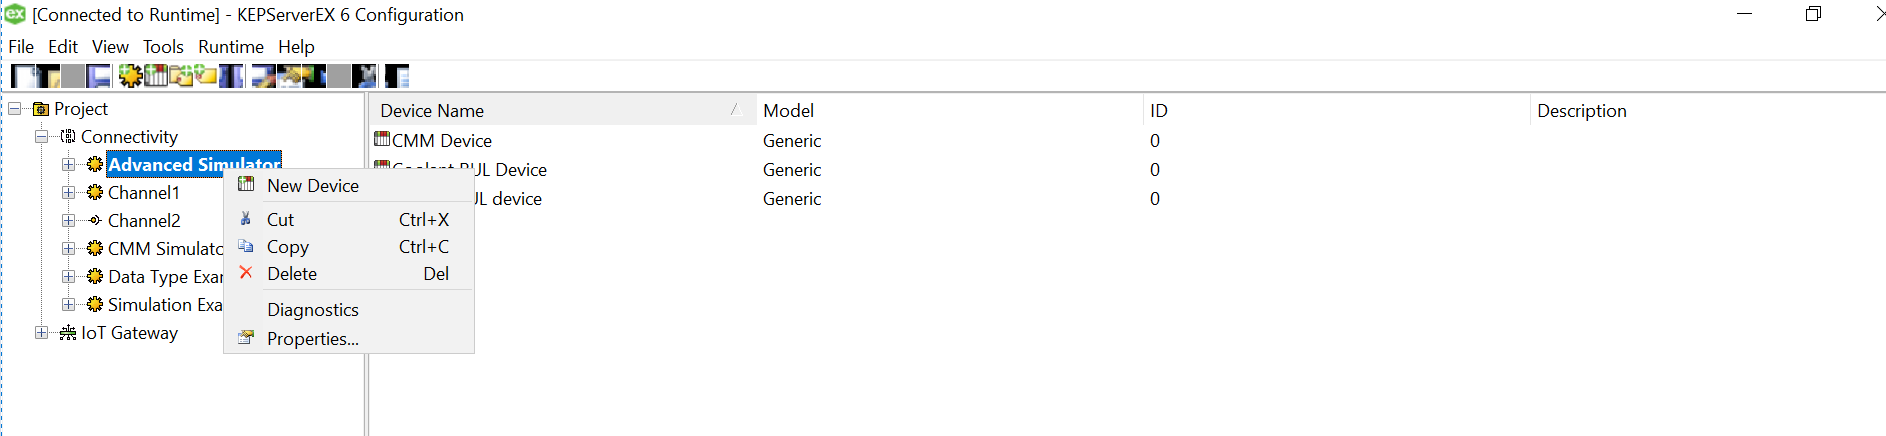
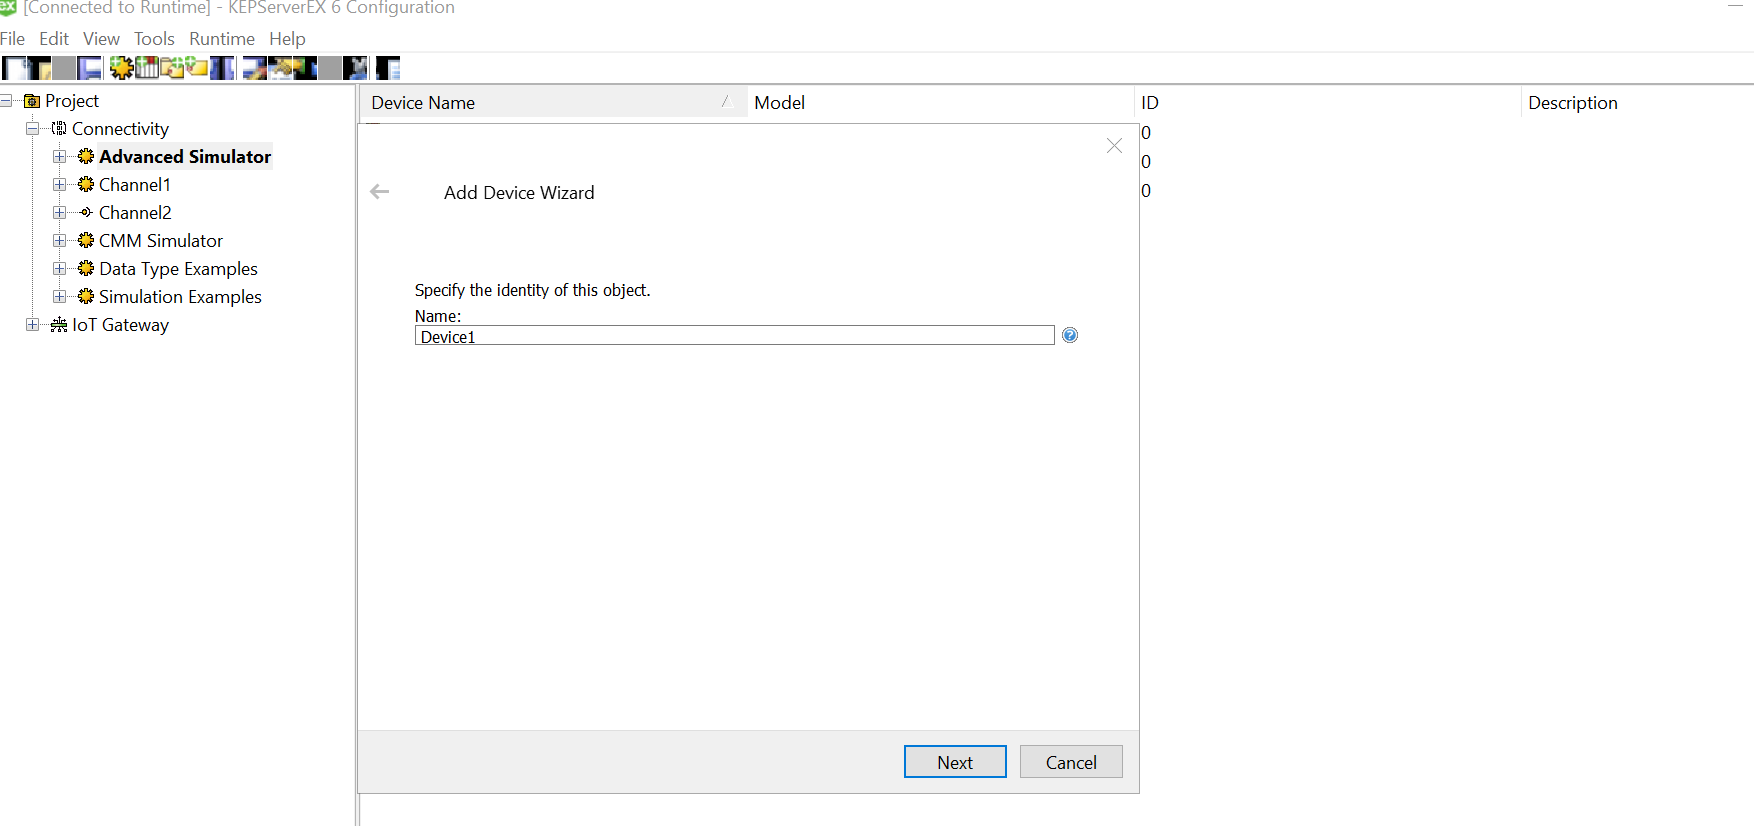
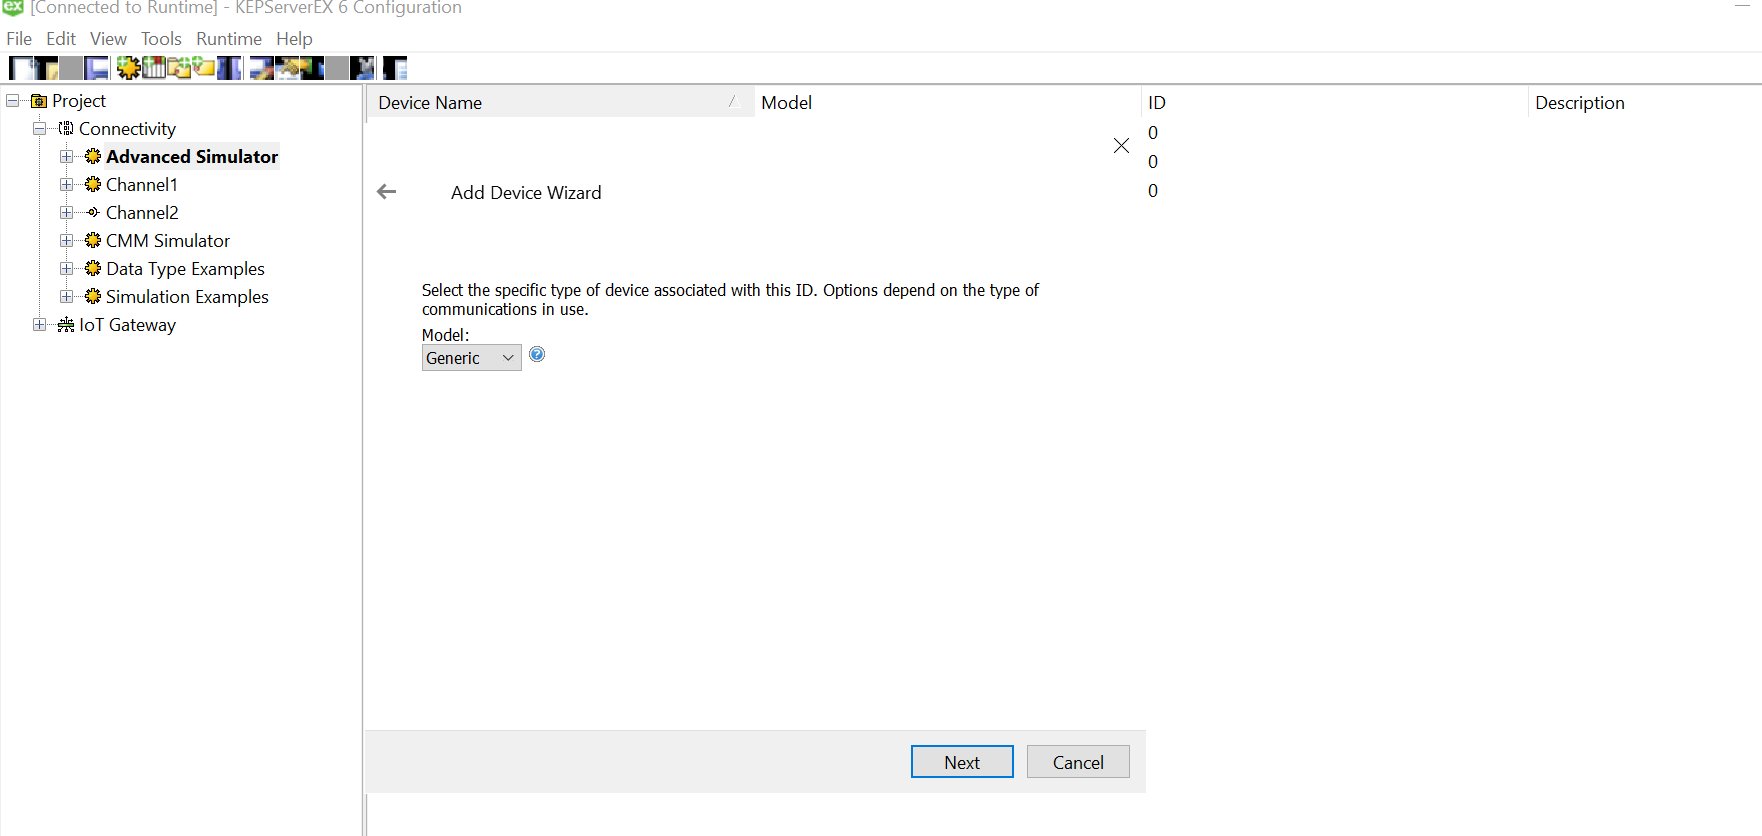
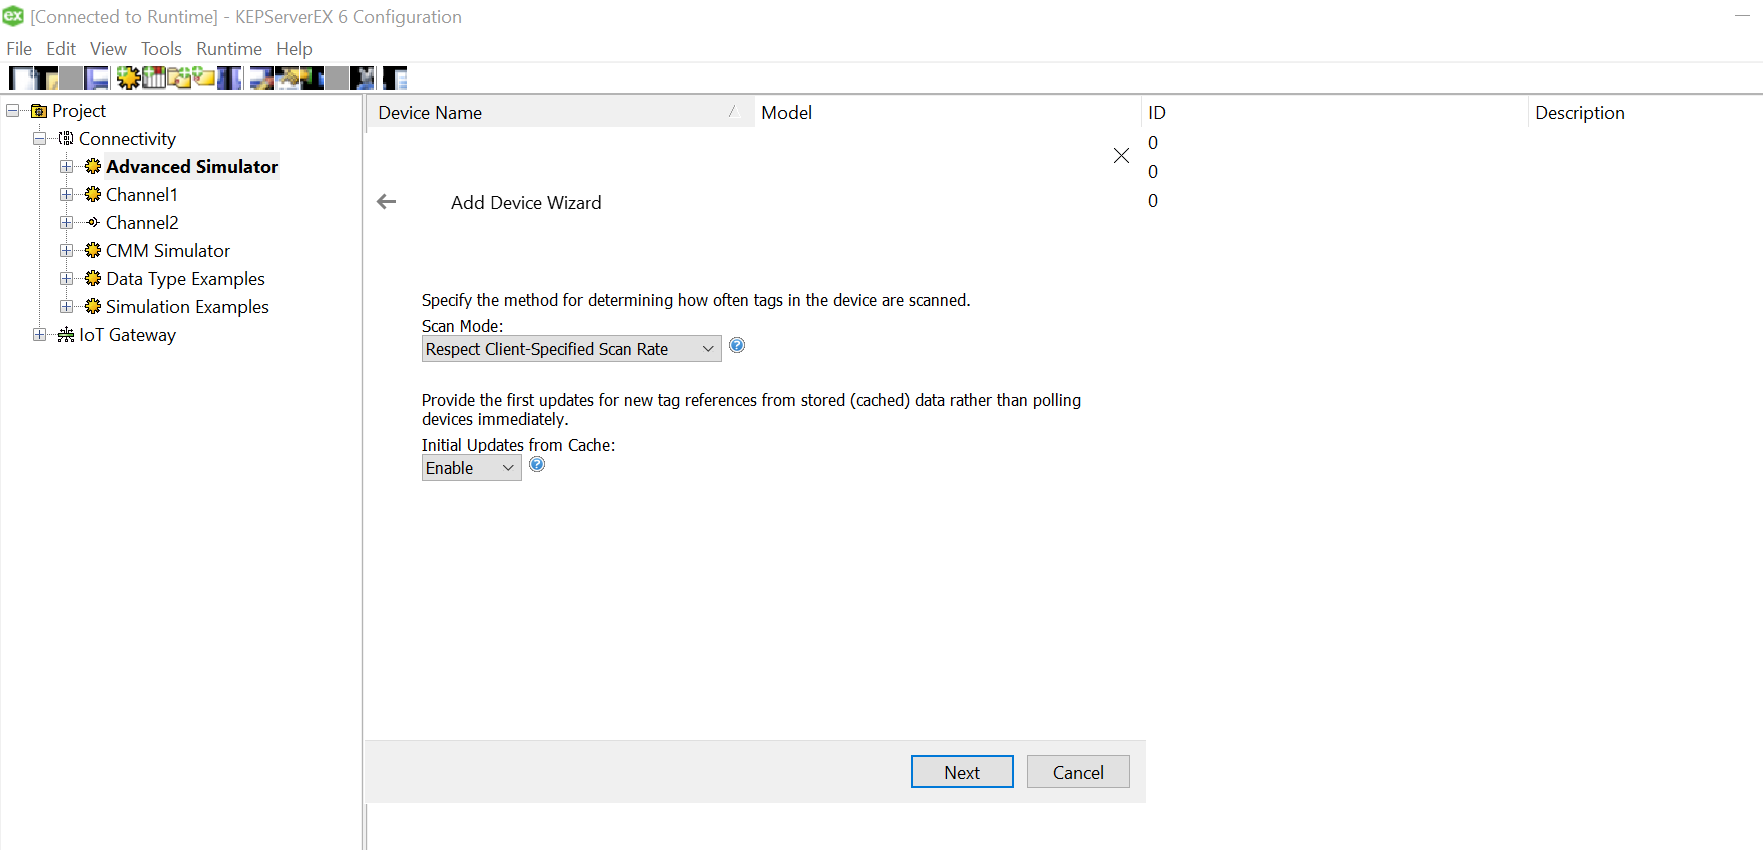
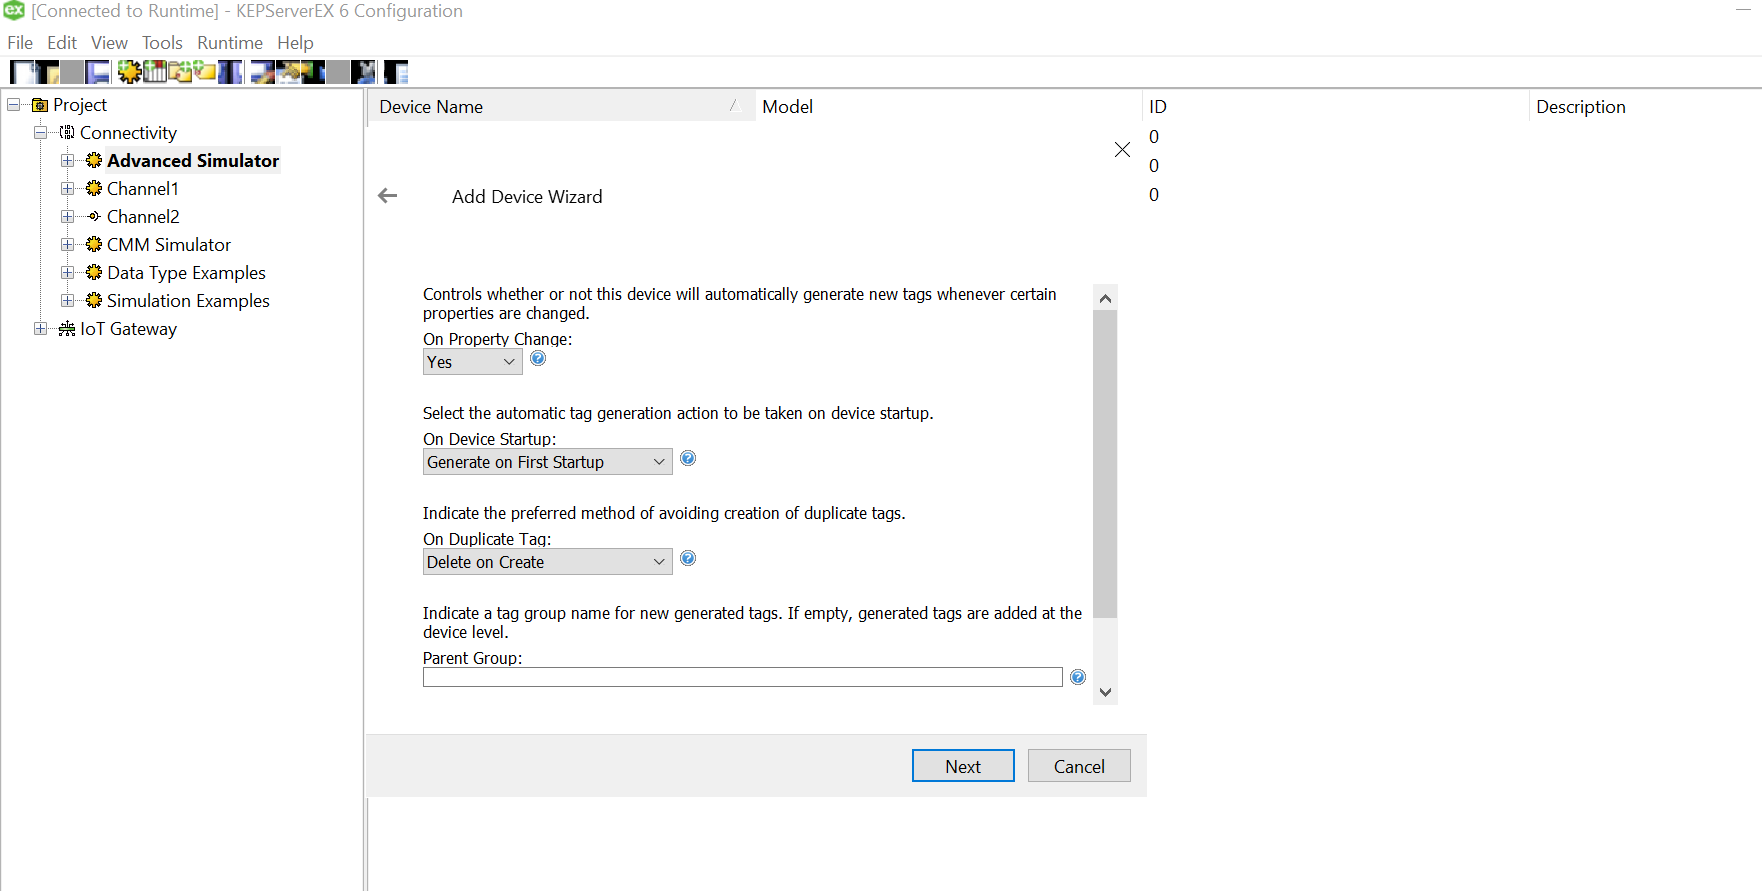
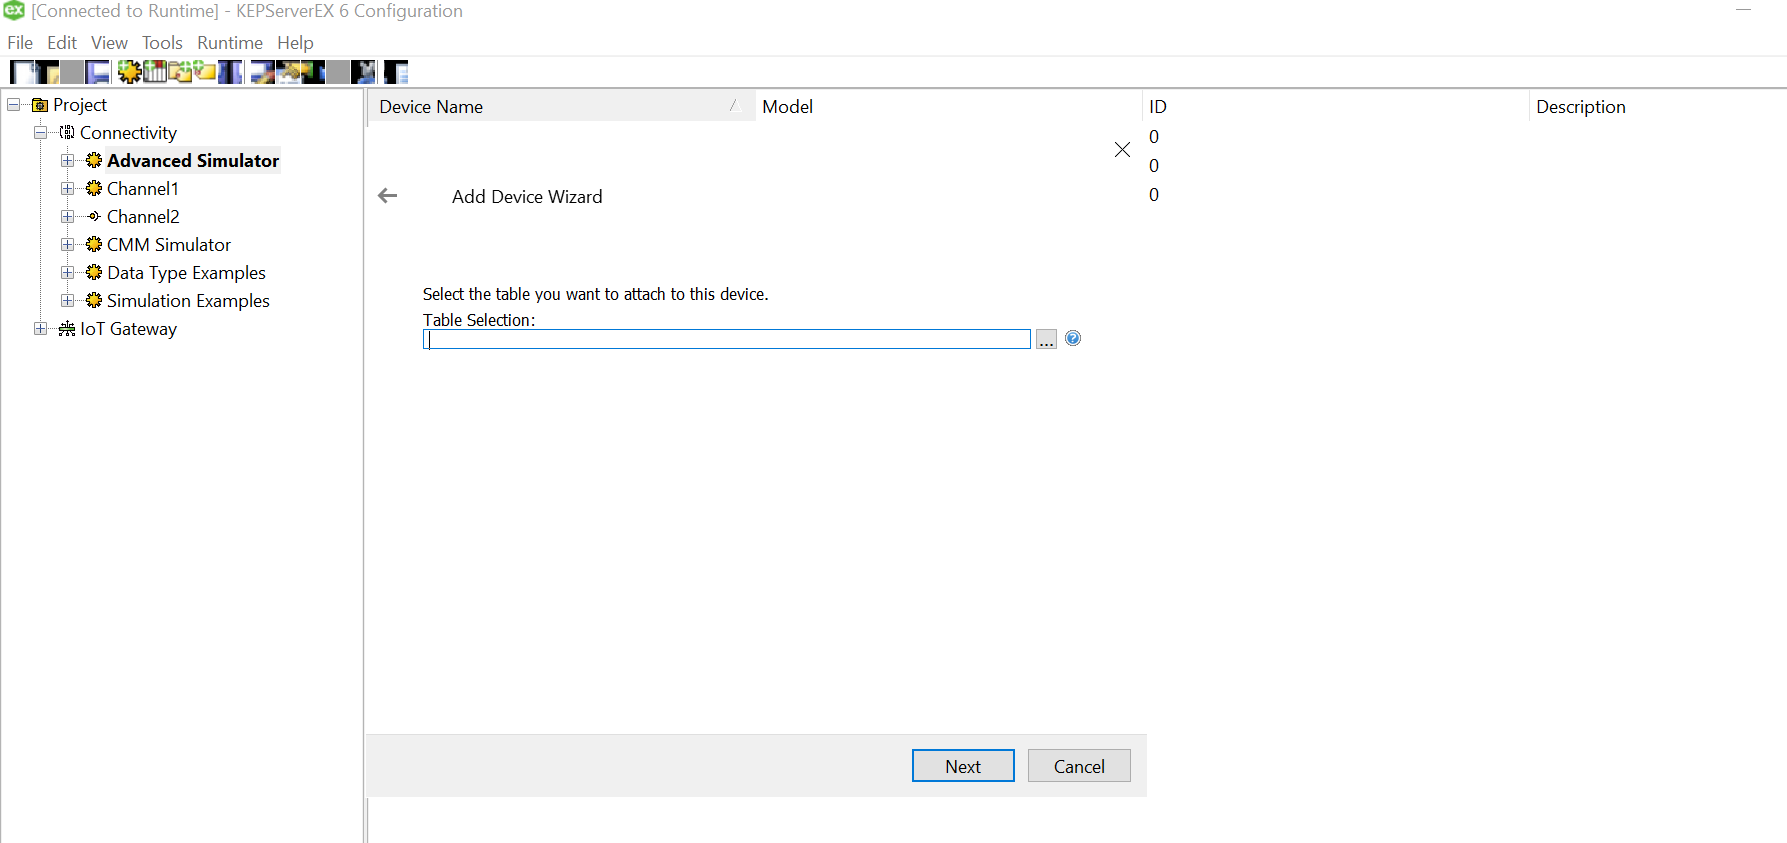 Click on the three dots and select the soecific csv for this device from the data source mapped earlier while setting up channel.
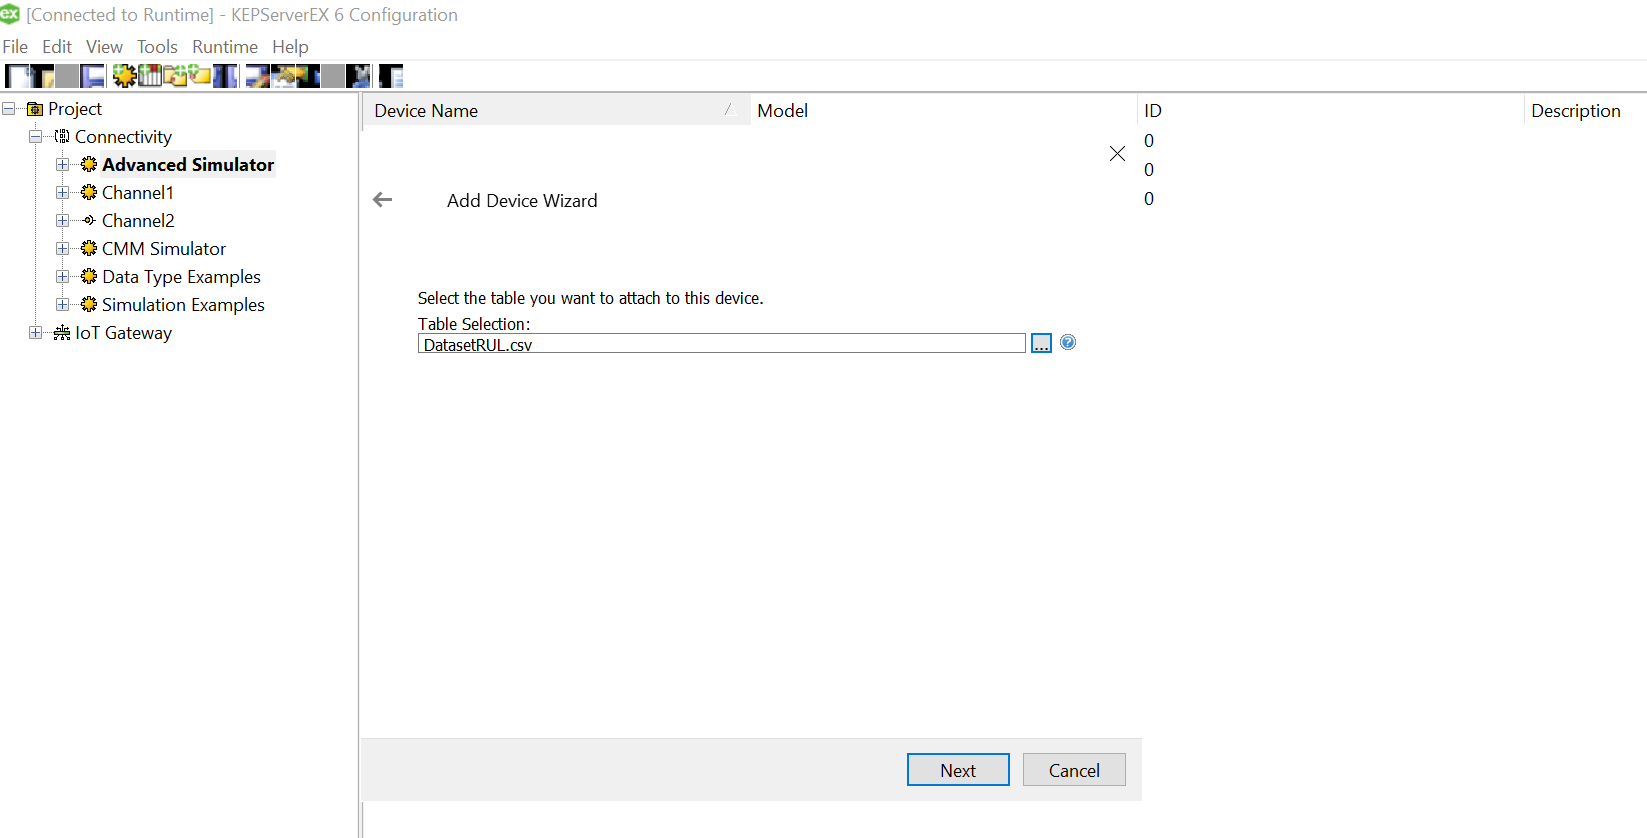
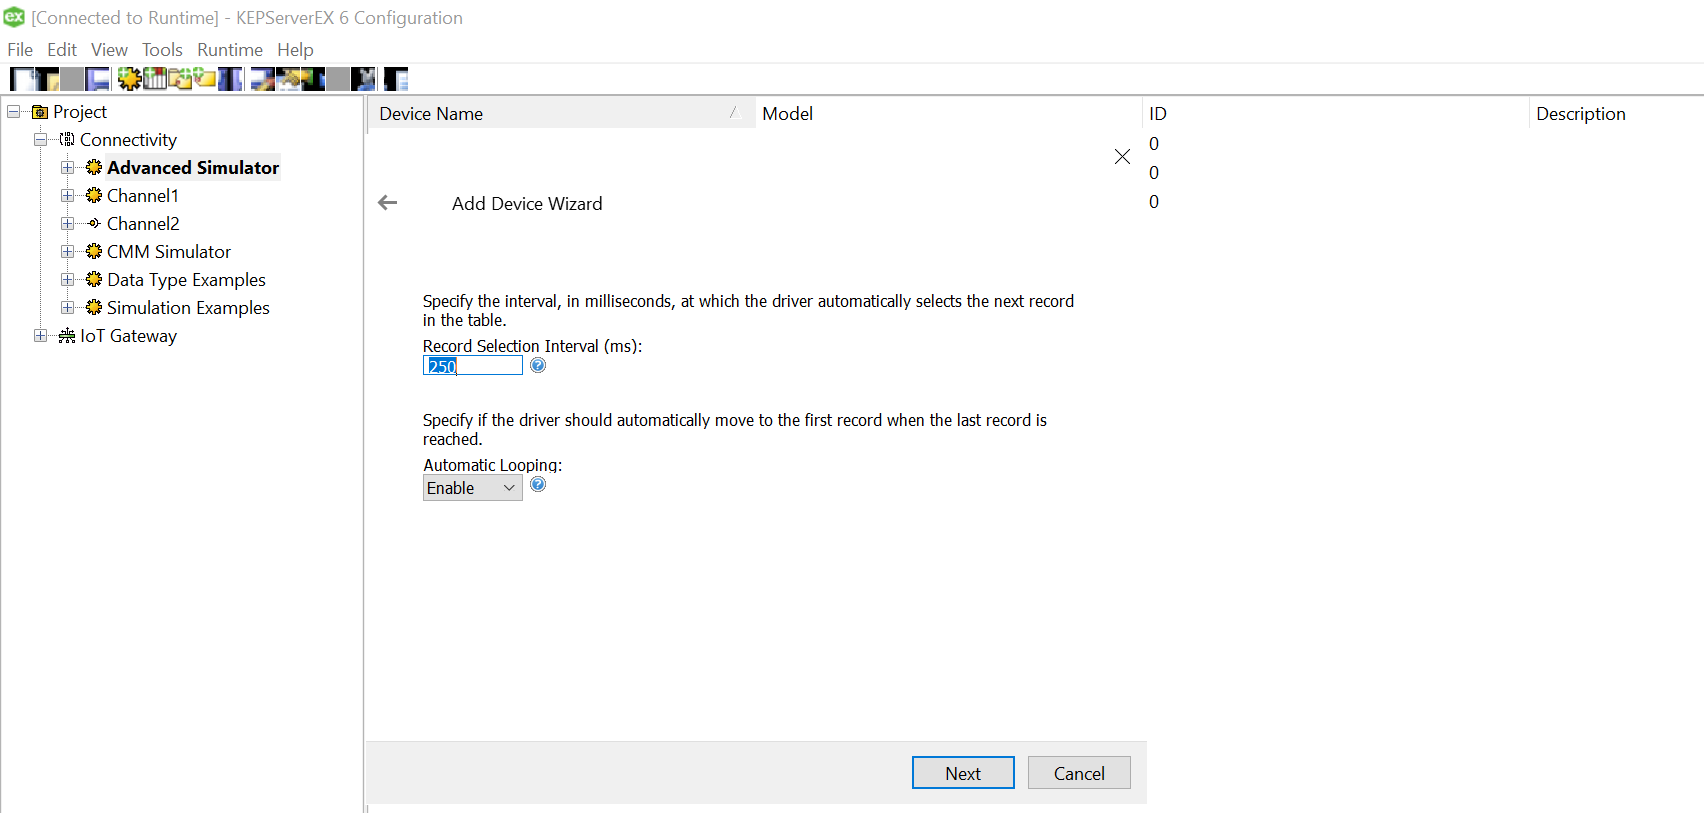
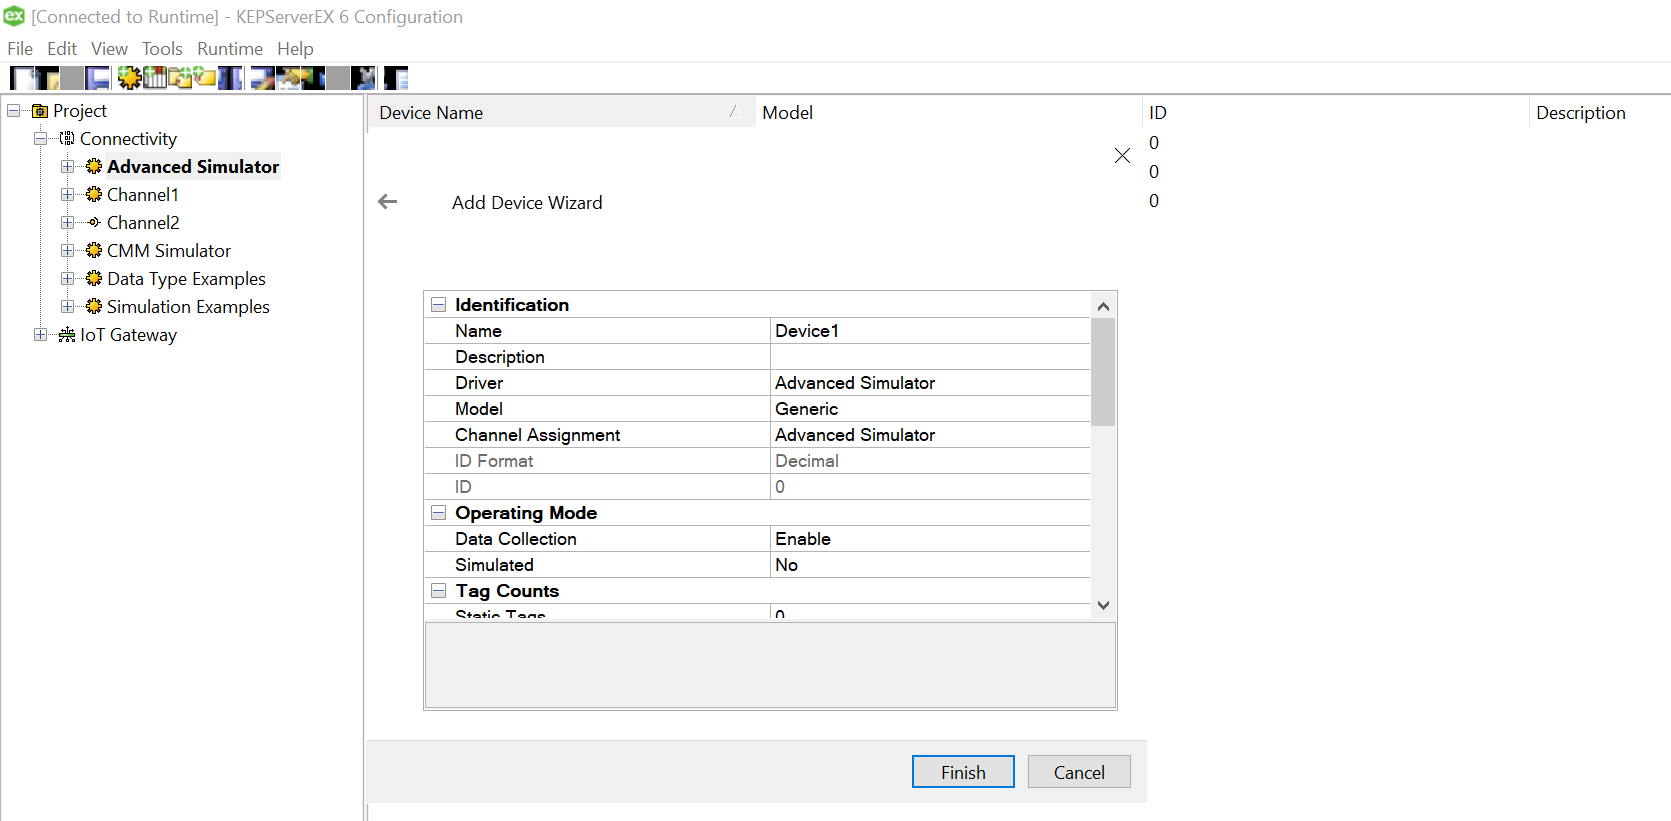 Click Finish and the device is successfully added, the driver should be able to “Generate” the TAG names from the column names. In case, the logs indicate an error as below, you may want to change OPC configuration settings to resolve it.