From MVH to MVH:The Career Arc That’s Killing Us!

This conceptual paper introduces the MVH Arc — a framework describing the trajectory by which high-performing professionals, particularly in the technology sector, migrate from being Most Valuable Humans to Minimum Viable Humans. Drawing on peer-reviewed research, WHO data, and industry-specific burnout studies, it argues that the human capabilities being systematically eroded by overwork culture are precisely those that the next decade of AI-augmented work will demand most. The framework is not academic in origin. It is observed. The author writes from the middle of it. It is a conceptual framework presentation at best which can further be explored for realistic empirical studies.

1. The Observation

My LinkedIn feed on a Tuesday morning this week contained 5-10 promotion announcements, 10+ certifications on various AI technologies and two obituaries.

From confetti graphics to AI certification badges to phrases like “excited to announce” to the photograph of the person in early forties perhaps was celebrated for promotion in another cycle.

Nobody connected the two posts. Nobody ever does unless you are the one closely affected.

2. The Connect

This article is an attempt to connect them (submitting that corelation is not causality), not through grief, but through a framework. A framework that I am naming the MVH Arc, and which I am documenting here with a timestamp, because I believe the next decade will make it necessary.

So let me state something controversial. You can call it my journal if you think it is untrue.

“The most valued professional is often the least “valuable” person in the room — and increasingly, the least likely to survive the decade in one piece.

If you’ve spent years becoming “indispensable” at work, this is probably happening to you - Senior ICs transitioning to leadership, managers in delivery pressure environments and other high performers gunning to be partners

3. Is this Anecdotal?

Is the crisis merely anecdotal? — Maybe not.

If overwork is a civilisational problem for the middle aged professional, the technology industry is its leading edge.

The sector that built the tools for always-on productivity has applied those tools most aggressively to its own people.

As for me, I didn’t notice this shift happening. It didn’t feel like a drop. It felt like growth. More responsibility. Bigger projects. Higher stakes.
But somewhere along the way, I optimized everything except being human.

4. Evidence

65% of engineers reported experiencing burnout in the past year. The 2025 LeadDev Engineering Leadership Report found only 21% of engineering leaders could be categorised as genuinely healthy — meaning the vast majority are operating in some state of depletion. [1]

67% of IT professionals report experiencing burnout, with System Administrators and DevOps Engineers recording the highest stress levels of any technical role.[2]

Perhaps the most clinically precise description of what is happening in the sector comes from a 2025 study of technology founders by CEREVITY, which introduced the term shadow burnout — defined as persistent exhaustion, cynicism, and reduced efficacy hidden behind continued high performance. The study found that 73% of surveyed founders met the criteria, with 68% actively concealing mental health struggles from investors and board members. [5]

5. My Interpretation

I may argue this is true for high performing professionals within many organizations, often working with high agency and semi-enterpreneurial or highly technical expertise often having to take decisions with platform implications. They are often in AI-induced technostress as mentioned in the Cerevity article, constantly under pressure to know it all, show it all, guide it all and what not!

Every other project and product team will have such an individual often attributed for visionary skills and remarkable turnarounds. Compressed learning and delivery cycle may eventually take a toll on these type of individuals. They will go broke and become less of a human, degrading in parts, if not in full.

6. The Framework Introduction

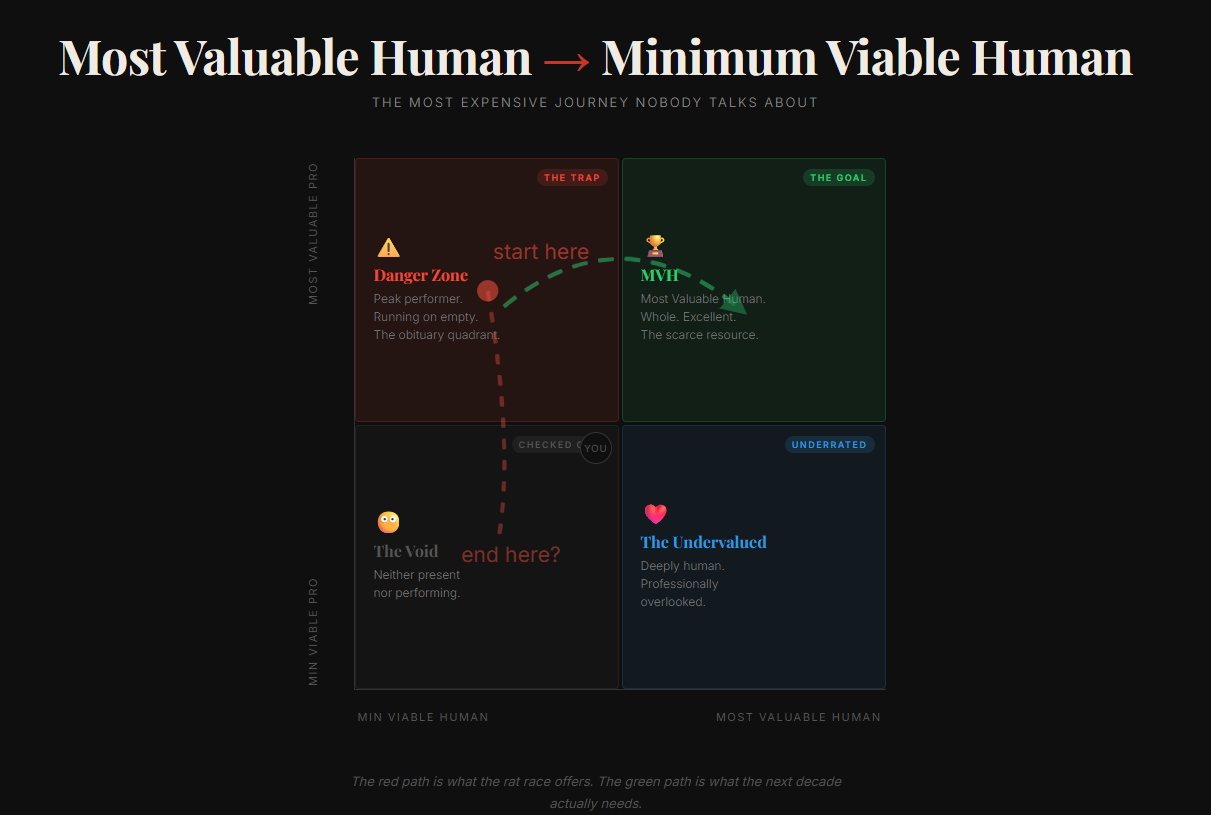
The Framework: From MVH to MVH – The just career arc for technologists/high performers

We perfected the MVP lingo — Minimum Viable Product. Ship fast. Ship lean. Learn and iterate later.

And the other MVP – Most Valuable Professional became its greatest achievement — certifications, promotions, AI badges, always on, always delivering.

But somewhere between the third promotion and the fifth burnout, the Most Valuable Professional became the Minimum Viable Human.

Functional. Deployable. Impressive on paper. Running on fumes and external validation..

Let me call this progression as

MVH Arc
Most Valuable Human to Minimum Viable Human

The most expensive journey you'll ever take. And the destination and the story arc are not really worth it. Let's admit that not all of are Mr. Robot from the series changing the world through anarchy. 

You know this person. You might be this person.

They show up. They deliver. They’re always on. But ask them the last time they laughed without checking their phone, sat with a friend without half a mind on a deadline, or simply did nothing — and watch them go quiet.

They haven’t disappeared. They’ve just been… optimized.

7. The Irony

The decade ahead won’t be won by the most optimized human in the room. That’s for the agent to be.

It will be won by the most human human in the room.

People with judgment. Empathy. Presence. The ability to sit with another human being and actually see them. That is the scarce resource AI cannot manufacture.

These are what AI cannot replicate. And we are systematically destroying them in ourselves, in the name of growth.

The decade ahead desperately needs Most Valuable Humans and less of MVPs.

8. Where am I?

I’ll be honest because this post deserves honesty. I have never been the most valued human in my own evaluation.

I have measured myself in output, in delivery, in whether I was useful enough. The professional scorecard was always full. The human one I kept meaning to get to that. This post isn’t wisdom from the other side. It’s a note from the middle of it while the change is in progress.

9. What do you do?

Track energy, not just output

Design “no optimisation zones” (health, family, thinking time)

Don’t let career growth outrun identity stability. Be identifiable in the end.

Drift & yet remain purposeful, like a solid, driftwood.


10. In conclusion

Most people don’t burn out.
They slowly stop being fully human.
And nobody notices — because the system rewards it.

The rat race doesn’t announce itself as dangerous. It just asks for a little more.

One more late night. One more certification. One more quarter.

FOMO does the rest because everyone else seems to be sprinting within the same cage. So stopping feels like failing until we faint.

But the most valuable thing you can be in the next ten years isn’t the most optimized professional in the room.

It’s a whole person who showed up. Someone worth knowing, not just worth hiring.

11. Remember

You are not a product. Stop shipping yourself into the ground.

There’s a better GitVersion of you out there, imperfect and unoptimized. You are not a costly GPU!

Know your life’s pace before you outpace.

Don’t be “Certified” Dead, at some point we all will anyway be one!

Don’t go from most valued to minimum viable human.

~ From one MVH professional to another ~ 

References

  1. Wellhub. (2025). U.S. Work-Related Stress in 2025: Key Stats & Solutions. wellhub.com
  2. DORA / Google Cloud. (2024). State of DevOps Report 2024. As cited in IT Support Group, 2025. thisisanitsupportgroup.com
  3. State of Engineering Management Report (2024) as cited in CIO Magazine (2025); LeadDev. (2025). Engineering Leadership Report 2025. leaddev.com
  4. Ketamine MC. (2026). Is the Tech Industry Facing a Mental Health Crisis? ketamc.com
  5. CEREVITY. (2025). Shadow Burnout Among California Tech Founders: The Hidden Crisis Behind High Performance. Survey of 127 founders conducted January–December 2025. cerevity.com
  6. Loaiza, I. & Rigobón, R. (2025). The EPOCH Framework. MIT Sloan School of Management. As cited in Futureneers, 2025. futureneers.io
  7. EY. (2026). Redesigning Work Around Human Skills in the Age of AI. ey.com

Using AI to Solve a Real-World Wastewater Problem – Zero Budget, No Consultants”

From Paper to production story of Human + AI – How I used LLMs as a domain soundboard, data validator, and simulation builder to manage my apartment’s sewage treatment plant!

The Setup

For the last two years, I have been voluntarily managing the sewage treatment plant of my residential apartment complex. Not because I am a wastewater engineer – “I am not” but because nobody else on the committee had the bandwidth (or so they told), and I had the curiosity to question things as I stayed closer to its vicinity . Also, managing STP was brutally hard, this space was notorious with frequent mails, shouting fixes and what not! So, in a way, this was also forced upon me. In hindsight, it was a blessing in disguise for me to learn something new and apply technology meaningfully.

What started as “just keep it running” slowly turned into something more complex. The plant was showing signs of overload during monsoons. The operator (humble plumber) said it was “always like this.” The trigger point was the helplessness of our plumber when he said, “There is so much water and you tell me what to do with it!”. The previous committee had limited documentation. The logs were inconsistent. The regulatory filings used assumptions that did not match what I was observing on the ground.

I had questions. How much water are we actually consuming? Where does it go after use? Why does the STP overflow seasonally? Is rainwater getting into the sewage line? Are we even compliant?

I had no budget to hire a consultant. What I had: two years of manually collected operational data, sensor readings from a couple of installed meters, hand-drawn site maps, commissioning documents from regulatory authorities, and field knowledge from our plumber who has been maintaining the system for years. Given my background (next segment), I had ensured that in my two year tenure, we approach this data driven, if manually collected. So, in 2 years, I had this body of work to assimilate Very Important

And I had access to something that did not exist two years ago – large language models that could reason across domains. In its absence I was a bit lost manually doing this number crunching and modeling.

My Background (and the Gap)

My day job involves enterprise platforms and Industrial IoT. I have spent years working with sensor data, systems architecture, data pipelines, and building solutions that connect operational technology with information technology. So the analytical side – collecting data, structuring it, building models, thinking in systems – came naturally to me.

What I lacked was the wastewater domain knowledge. I did not know the standard hydraulic retention times for an aeration tank. I could not tell you what MLSS levels indicate healthy biology. I had no reference for what percentage of domestic water typically becomes sewage in an Indian residential context.

I was genuinely curious: could an LLM fill that gap? Not replace an expert, but act as a domain soundboard – the way a knowledgeable colleague would if I were brainstorming at a whiteboard?

What I Did

I spent roughly two weeks in deep collaboration with an LLM (primarily Claude, with some use of GPT for cross-validation and M365 Copilot for enterprise document workflows). Here is what that collaboration looked like:

Phase 1 – Data Collection and Structuring

I fed in two years of manual logs, sensor data exports, hand-drawn P&ID diagrams, regulatory documents, and field observations. The LLM helped me structure this into a normalized format – a 17-worksheet operational workbook covering asset inventories, maintenance schedules, daily logs, chemical dosing records, and process parameters.

This alone would have taken me weeks manually. With the LLM, it took about two days of iterative back-and-forth.

Phase 2 – Water Balance Analysis

This is where things got interesting. I needed to understand the full water balance: how much comes in, what percentage becomes sewage, how much is treated and reused, and critically – how much “extra” water was entering the STP that should not have been there.

I used the LLM as a calculation partner. I would share sensor readings, it would build the formula, I would cross-check against field observations, and we would iterate. The LLM caught a calculation error that had been sitting in our records for over a year – a “ghost” inflow number that previous analyses had been trying to explain with increasingly complex theories. Turns out it was a simple arithmetic mistake in the original model. We had been chasing a problem that did not exist. The fact that consumption and efficiency in some other places increased our fundamental inflow was something we all had neglected!

Nose on the wall, ha!

The corrected water balance revealed the real issue: rainwater was entering the sewage system through pathway floor drains during monsoons – a classic Inflow and Infiltration (I&I) problem. A physical site walk confirmed what the data model predicted. LLM suggested all interventions even the ones I knew and said what should I do to find it given I had fed detailed flow diagram.

Phase 3 – Scenario Modeling

Once the base model was solid, I asked the LLM to help me build seasonal what-if scenarios. What happens in dry season vs monsoon? What if we seal the infiltration sources? What if residents reduce consumption by 10%? What if we install dual-flush systems?

Seven scenarios, each with cost projections and capacity impact analysis. The kind of analysis that would typically require a consulting engagement.

Phase 4 – Deliverables for the Committee

The raw analysis is useless if the committee cannot understand it. I needed to translate engineering data into plain language that non-technical residents could follow. The LLM helped me produce:

  • A committee-ready briefing document with visual summaries
  • An investigation checklist for the next committee to pick up where I left off
  • Cost projections for both completed work and future actions
  • An executive summary for the annual general body meeting

Phase 5 – The Simulation App

This was the part that surprised me most. I specified the requirements for a desktop-based water balance simulator in about an hour – sliders for consumption patterns, checkboxes for seasonal conditions and infrastructure fixes, a live capacity gauge, animated flow diagrams showing water movement through the system.

Here is the simulator in action – a compressed 24-hour cycle showing how each tank behaves across a full plumber shift and overnight:

Watch the EQ tank fill overnight when the pump is off, and drain during the day. The DO (Dissolved Oxygen) gauge crashes during the 2-hour blower gaps and recovers when the next blower kicks in. Every tank has independent physics – I caught a bug where the aeration tank was rising after the pump stopped. It should drop. Getting this right required understanding what’s pumped vs. gravity, what’s continuous vs. scheduled.

The LLM (Claude Opus + Claude Code) generated the entire frontend (React-based, standalone, runs on a laptop with no internet). I focused on the data model and validation; it built the visualization and interaction layers. The result is a working proof-of-concept that I can demonstrate live at the general body meeting – residents can see in real time how sealing a drain or reducing consumption affects the plant’s capacity.

Bonus: Phase 6: The Hidden Cost Cascade

Every committee tracks the Cauvery (Water) bill. Almost nobody tracks what that water costs after it goes down the drain

  • Blower overload — more water = higher backpressure at diffuser depth. O₂ margin shrinks from +90 to +6 kg/day
  • Pump wear — RSLP, FFP run 30-75% more hours than designed. Motor replacements 2x faster
  • Compliance risk — CPCB 2026 norms: BOD<10, DO>4. Overloaded STP can’t reliably meet these!

Every extra KLD costs ~₹Lakhs/year in hidden STP operations cost! The upstream-downstream link is invisible by default. No maintenance ledger connects the Cauvery bill to the STP electricity bill to the pump replacement cost. AI helped me trace the full chain – from one extra shower to ₹5X,XXX/year in hidden STP costs. That single insight changed the committee’s conversation from “STP is fine” to “we need to understand our water budget.”

Where AI Genuinely Surprised Me – Hypothesis to Theory to Application!

Let me be specific about where the LLM added value that I could not have replicated on my own in the same timeframe:

As a domain soundboard. I would describe a symptom (“the EQ tank level rises overnight even when no one is using water”) and the LLM would walk me through possible causes – infiltration, groundwater seepage, leaking valves – with diagnostic steps for each. It was like having a knowledgeable colleague available at midnight. [ This was totally outside work and hence often really midnight 😉 ] This all happened because I had seen this pattern once before as well. I had earlier used an LLM to think through a soundproofing problem around the plant – target noise reduction, material options, procurement considerations, and how to measure whether the intervention actually worked. That gave me early confidence that AI could be useful as a practical soundboard when expert access is limited.

As a cross-validator. Every assumption I made – population estimates, per-capita consumption norms, return rates – the LLM challenged with references to Indian standards (IS:1172, NBC guidelines). It forced me to justify my numbers, which made the final analysis much more robust.

As an error catcher. The “ghost inflow” story I mentioned earlier. I had accepted a number from a previous analysis without questioning it. The LLM, working from first principles, flagged the inconsistency. That single correction changed the entire narrative of what was wrong with our STP.

As a visualization builder. I know data and backend systems. I do not build React frontends for a living. The LLM bridged that gap completely – generating production-quality UI code from a natural language specification. My role was to validate the math and the user experience, not to write CSS.

What I Learned (The Hard Way)

These are not theoretical observations. Each one cost me time, rework, or a moment of “wait, what just happened?”

1. LLMs fail brilliantly. When the context window overflows mid-reasoning, they do not make small errors. They silently drop entire sections of work – worksheets, formulas, validation steps – without any indication that something is missing. I lost a complete worksheet once because the model ran out of context and simply did not include it in the output. No error message. No warning. Just gone. I had to start off from 10 versions behind.

The fix: validate after every step. Not at the end. Every step. Do step 4 to avoid it.

2. Guardrails matter more than specifications. Especially the negative ones. Telling the model “do not modify any sheet other than the one we are currently reviewing” was more impactful than detailed instructions about what to do. If you have worked in enterprise architecture, this will feel familiar – constraints define the system more than features do – Read NFRs.

3. Challenge the LLM like you would challenge a junior analyst. Say “I think you made a mistake here – check this again.” Nine times out of ten, it recalculates, finds the error, corrects it, and – here is the key – internalizes that correction for the rest of the session. This is essentially what Judge LLMs need to do systematically: validate, challenge, and correct after every reasoning step.

4. Decompose ruthlessly. Break the problem into units small enough to validate independently and retract if wrong. If you cannot verify a step on its own, it is too large. I learned this after a batch update corrupted data across multiple sheets because I had asked the model to do too much in one pass.

5. The human is still the architect. The LLM accelerated everything by an order of magnitude. But the domain intuition – noticing that the plumber’s observation about “monsoon overflow” correlated with the pathway drain locations, connecting that to the sensor data anomaly, deciding to physically walk the site to confirm. While I owned this “chain of reasoning”, AI made it faster to act on those insights and critique my iniital observations. It also made mistakes but recovered eventually with right prompts.

The Bigger Takeaway

The gap between “enterprise technology professional” and “community problem solver” is thinner than we think. The same skills – systems thinking, data triangulation, stakeholder communication, iterative design, knowing when to trust the model and when to trust the field – apply whether you are architecting a cloud platform or optimizing a treatment plant.

What has changed is the accessibility of domain expertise. Two years ago, I would have needed a wastewater consultant to do what I did in two weeks. Not because the consultant knows something fundamentally unknowable – but because the knowledge was locked behind specialization. LLMs are flattening that barrier. Not eliminating the need for expertise, but making it accessible to adjacent professionals who bring complementary skills. This goes vice versa for a domain expert to build simulation software with LLMs and not developers.

What is Next

I am exploring what I can open-source from this effort. At minimum, operational templates that any apartment committee can adapt – asset registers, maintenance checklists, log formats, handover documents. Perhaps a longer technical write-up on the water balance methodology. And if there is interest, the simulation app framework itself.

If you are managing infrastructure in your residential community – or thinking about how AI applies to problems outside your core domain – I would be happy to exchange notes.

Disclaimer: I am not a wastewater management expert. I am an enterprise architect with an Industrial IoT background who enjoys solving real-world problems and connecting dots across domains. The best way to learn a tool is to point it at a problem that matters to you.

#AI #LLM #WasteWaterManagement #RealWorldAI #ProblemSolving #EnterpriseArchitecture #IndustrialIoT #ClaudeAI #Copilot #Industrial #sensor #datafoundation #analytics #context #retention #domaindrivendesign

The Industrial Metaverse, Digital Twins & More – Beyond the Narrative!

Much has been written about Metaverse over the last few months. So called the “New Internet” or the “New Application Experience” has become a part of our extended lexicon more that what we may want, but, the truth is, there many more hurdles before it becomes an indispensable part of our daily life, like mobile apps and websites. Perhaps that is why Gartner marked it a good 10 years away from becoming part of our behaviours.

From a component architecture perspective, there are a lot more moving parts to this stack. Yet there is one specific aspect of this new concept that deserves attention – The Industrial Metaverse. This is spoken in conjunction with IIoT, Industry 4.0 and 5.0 with much fervor.

Just like me, you may wonder, we always had digital twins and what is the new angle here! Let us understand a few things before we peel the architectural onion of Industrial Metaverse.

Everyone has been talking about – “let us build a Digital Twin” quite synonymous with metaverse and plain simple 3D model visualization of machines and plants, which is half the truth. A good looking, interactive 3D model or an ability to show some data on top of 3D models or a simulator with 3D models attached is not a Digital Twin! At least, I don’t subscribe to that definition.

How do I see the Industrial Metaverse forming? - From an evolution of Virtual models and OT technology solutions.

Product Engineering teams always had high resolution, detailed 3D models of various formats, with companies like Dassault systems giving good workbenches to import, build and simulate pre-created scenarios in order to test faults on these machines – Virtual Twins. These concepts started moving further into plants and processes with the question – why are we not using these models to monitor actual plants and their operations. But then they were siloed with singular models from the vendor platforms whereas the processes definitely sat outside of those platforms in the plant ecosystem. They had sophisticated simulators but then they were not a software representation of the actual plants, assets and processes. Also, it didn’t work hand in hand with other vendor machines and their simulators. Most importantly, real data could never stream into these workbenches.

On the other side, manufacturing execution platforms and hyperscaler platforms like Azure and AWS were wondering about helping factories and plants with real time representation of their shop floor data, securely, at scale – to model assets & process, to predict events, to prevent the scenarios using Industrial Platforms. They were expanding their plant or cloud knowledge moving from OT to IT, or IT to OT.

Value chains were getting extended. Both of them were searching for a / set of software services to bridge this chasm of real time data and process handshake, each partnering or building full stack solutions.

Note: All the while, manufacturing plants were looking for value and not expensive technologies!

Let us call the middle region as Digital Twin – a software representation of the assets, processes, and behaviours that memoise the system, contextualize data inside the system, and raise events based on the connected behaviour of system workflows, like a point in time. I often call this as the working memory of the system with a limited playback capability. This crucial component adds to the real time nature of the system in between.

This Digital Twin is the secret sauce to having a good Virtual Twin on the top and a low latency (autonomous or condition based) control feedback to Industrial Platform below.

Paraphrasing one of the Siemens executive’s statement (will be attributed once I figure out the details)

Consumer metaverse may not need real time data but industrial metaverse needs real time data to succeed.

Hence, the platform in the middle with the bindings between the layers should bring the real time data view of the plant / factory / industry to the virtual world seamlessly (making the metaverse possible).

You could see from the earlier rough sketch that there are broadly 2 interfaces needed to make this happen. One that elevates the virtual twin experiences to make it closer to Metaverse experience continuum mentioned in the earlier blog of mine. And the next, of getting real time information from the OT / physical ecosystem within factory. These 2 are integral to changing the current status quo of plain 3D models with data to a metaverse application.

  1. The Visualization Interface for Metaverse Apps

Virtual Twin with the Digital Twin binding is what creates the entire universe of Metaverse Apps which are highly responsive, rendering of the plant that enables us to seamlessly access a particular machine in a plant and troubleshoot remotely. Definitely that needs infrastructure support like 5G and 6Gs but also some like of spatial software support for seamless collaboration and space sensing. The component architecture I can think of is Microsoft Mesh. I don’t want to repeat Microsoft documentation here.

https://techcommunity.microsoft.com/t5/mixed-reality-blog/microsoft-mesh-a-technical-overview/ba-p/2176004

I believe that the link above gives a very good idea of how that platform should evolve to give the seamless B2B2C experience that I was mentioning in my previous blog. It talks of the immersive presence, spatially anchored maps, rendering acceleration, multi user shared experiences, streaming data, security, an Out of the Box SDK that enables application layer acceleration with the data binding from the API layer below (digital twin layer).

I would like to add that, this experience should be as simple as listening to Microsoft Teams on mobile MS Teams App and transferring the call to a desktop MS Teams application with just a simple button click, without any latency. Also, in the context of Industrial Metaverse, this would be much easier to setup as you can have dedicated infrastructure like 5G, Active Directory based secure logins inside wearables, controlled devices, limited number of users simultaneously logging in and the like. This can ensure that we guarantee similar infrastructure at network, connectivity, device, security layers with ample governance like today’s internet and the devices used to access information from within a manufacturing facility.

2. The Data Interface for Industrial Data

With numerous firewalls and air-gapped networks from factory floor to internet, this was one is a tougher interface. Good news – This is almost a solved problem, thanks to many of the private and hybrid networks, high security interfaces, localized secure processing on purpose made hardware, limited data exposure, one way communication that avoid command and control interfaces etc. This limits the exposure of OT, at the same time gives as much data and processing needed, at speeds and latency acceptable to populate the Digital Twins in the cloud middleware. Also, the fact is that many of the hyperscalers have software runtimes and stack that start from the cloud and extend to the edge within OT. MES systems are upping the game with their stack starting from the Edge synchronizing to the cloud. This gives opportunity to run reactive, predictive and preventive workloads within Edge and cloud, with visualization and actions that can go back and forth Physical Space and Digital Twin.

With these 2 interfaces maturing, you can possibly have the Industrial Metaverse sooner than a Consumer Metaverse. May be it is already here.

There are a lot of innovative solutions from PTC, Azure, AWS, Siemens etc. their numerous partners and many Solution Integrators etc. showcased and deployed to clients. Many such light solutions, or wannabe Metaverse solutions are already PoC-ed or used at Industrial facilities, for example, check out this build session. towards the 20th minute. This detailed Microsoft blog (image below) with examples give the full stack view of their Industrial Metaverse. Here, the digital twin layer, abstracted in my blog, holds the Azure AI and autonomous systems, Synapse Analytics, Azure Digital Twins together to build the middle stack. Azure IoT is the Data Interface for factory, Microsoft Mesh is Visualization Interface for Metaverse Apps built on HoloLens like devices. Power Platform is part of the Digital Twin layer but the application interface called PowerApps is still in Metaverse. I am sure an expert on another stack will have something similar.


As per the case studies presented here, helping us build simple digital representations, virtual worlds, autonomous self correcting systems and more.

To summarize, I believe the Industrial Metaverse is already here in many forms, in its many light weight avatars.

Our joint effort should be directed towards creating the right experience continuum within the use cases, to create tangible and usable solutions for the end personas helping them – to remotely collaborate, to improve the first time fix rates ,to visualize the impact of predicted changes, to build muscle memory of operators and the like.

Disclaimer: Author works for Accenture and uses Microsoft services to architect and build Manufacturing platforms and Applications on top of it.

Media Images generated by DALL.E 2

Previous blog – https://3logr.com/2022/09/27/moving-from-met-averse-to-metaverse-apps/

Kepware Server and Advanced Simulation from CSV files

Off late, I have been working with Industrial IoT projects with Kepware Server, Azure IoT Edge and IoT Hub. During one of those, there was an ask to use an excel file with hand crafted data to be used as input data source at the edge. While investigating options including writing custom module at the edge to read the excel and send row by row, I realized that Kepware Server can be used along with Advanced Simulator. Being a noob on Kepware this was quite a surprise.

As I started configuring this, it took sometime to get this up and running and definitely a few steps and caveats along the way. So I thought why not give the screenshots and walk you through the steps and configuration needed.

Before I got ahead thanks to my friend Akhila (akhilahebbar@outlook.com) for troubleshooting and figuring out some of these specific roadblocks which a noob like me was trying to figure out from manuals.

Let’s us go ahead and deep dive into the Kepserver Ex and learn the specifics of using Advanced Simulator driver.

Simulator Setup

Let us create a new channel and set the type of the channel to be Advanced Simulator

Provide a useful/meaningful name to the channel and proceed.

Since we won’t be changing much of the default settings for this demo, let us leave the next pages as is and proceed.

Let us add the data source.. this is where csv is used. Click on the “Configure DSN” and Hit the Add Button on the right of the pop up window.

We need to select the driver for data source. We have an xls file with multiple columns. We converted that into a csv file, so we could use a Microsoft Text Driver (*.txt,*.csv).

Give a meaningful name to the data source and after that select the directory where you have stored your converted csv files, with columns having your simulated data. Ensure that your headings are meaningful as that become your tag values. Also, make sure it doesn’t have space between the text or leading spaces. That will make the tag reading erroneous.
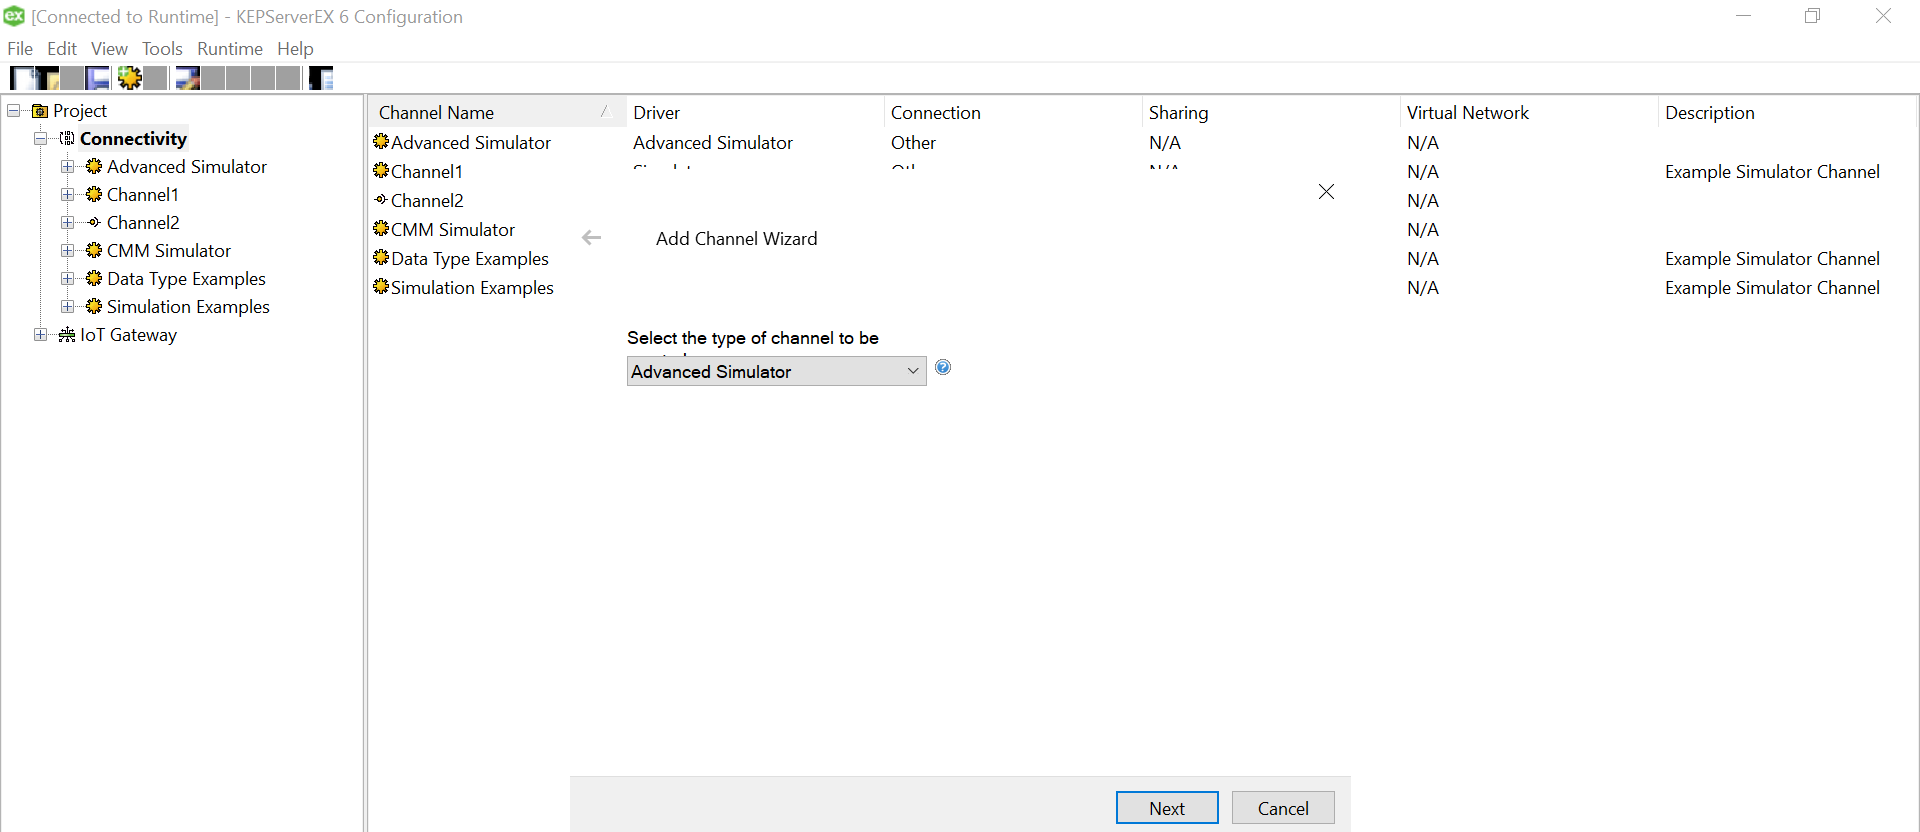
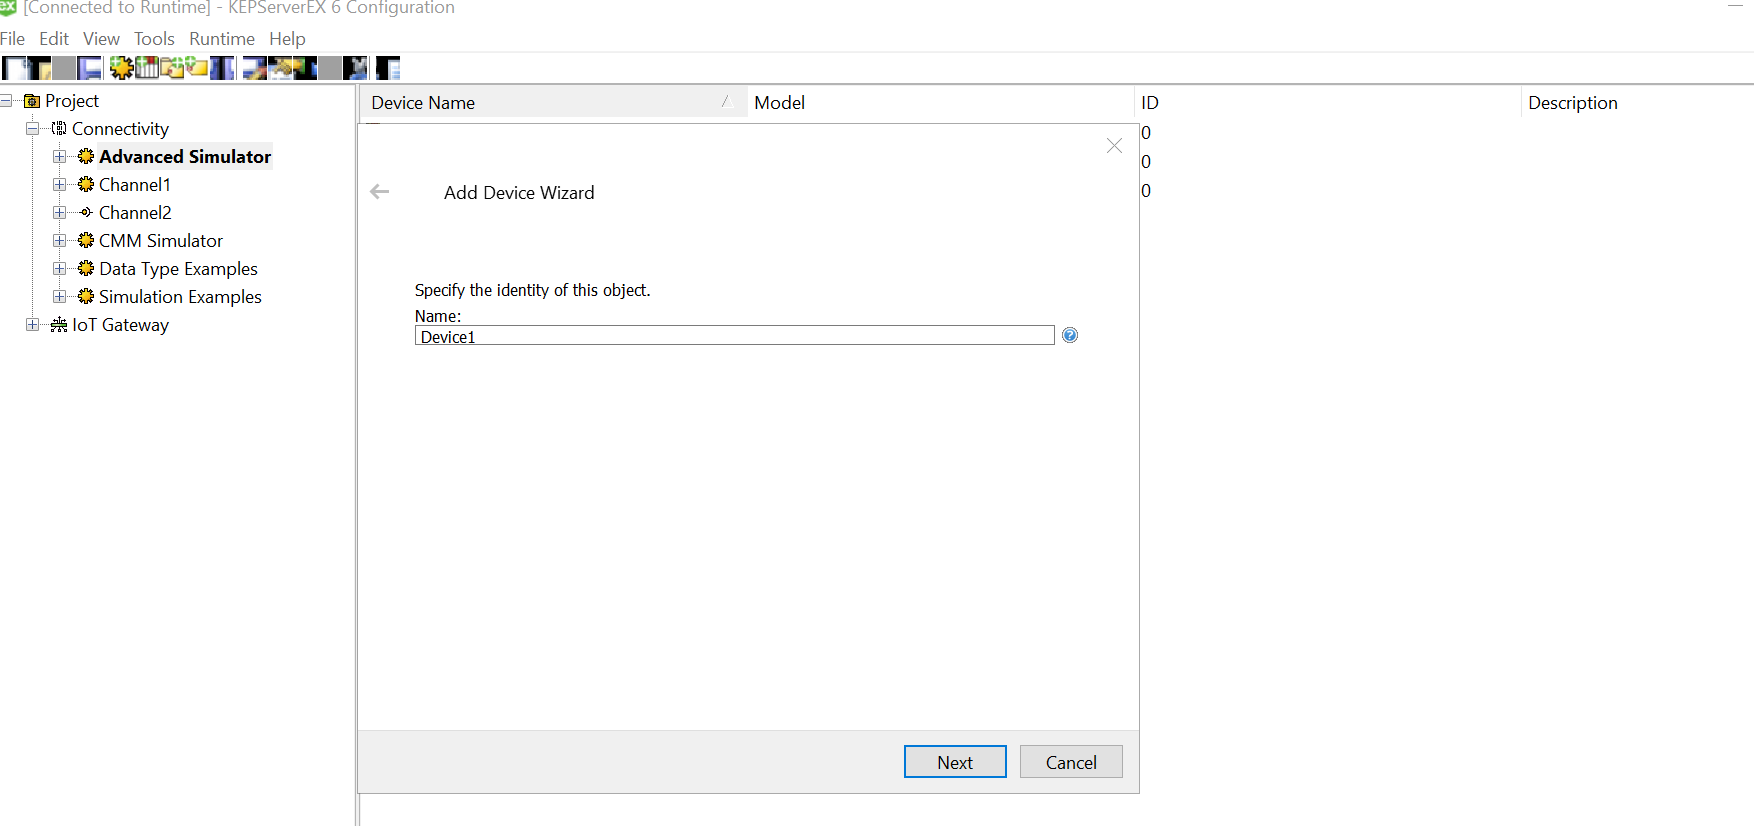
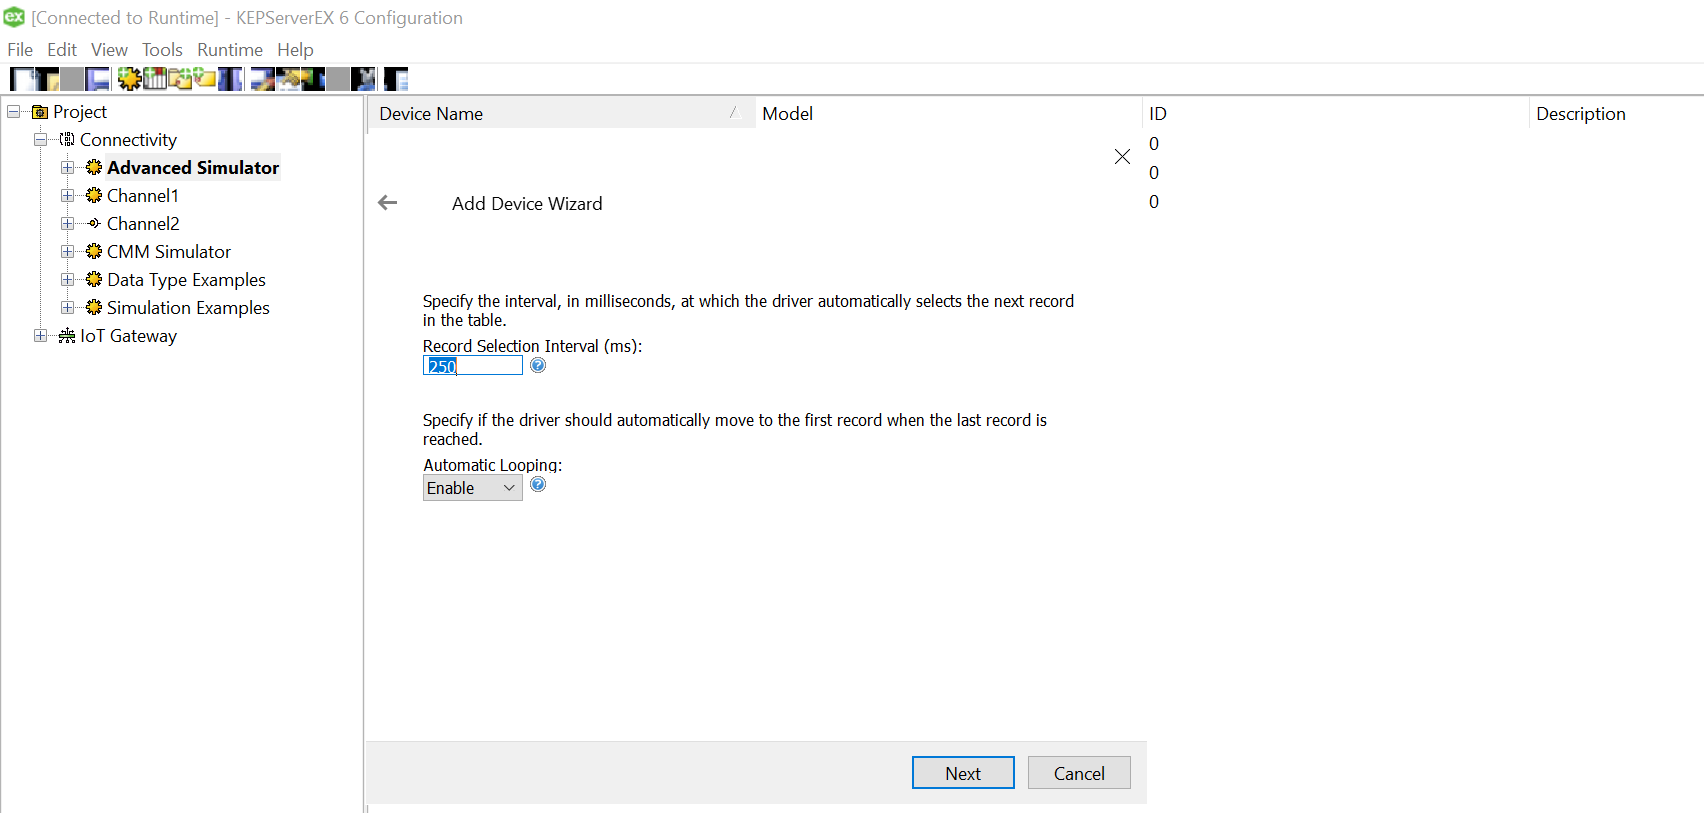
Use “Define Format” feature to select the columns and guess the tag rows. That will help you know if the file is being read correctly. If there are changes to delimiters and stuff we can give all those customizations here. We had a standard csv.

Click on Ok and we are done with the Data Source Name creation with the files specified in the folder.

Select the data source that just got created under the “Add Channel Wizard” and click Next.

Click “Finish” to complete adding the Channel.

We need to add device that can now read the files from the data source. Right Click on the Channel that got created previously and click on “New Device” to get started.

Setting up a device

Choose a meaningful name for the device and leave the next window as default in the wizard.

Setting the “Initial Updates from Cache” to “Enabled” helped us create those tag values automatically. Leave the Next wizard as default until choosing Table
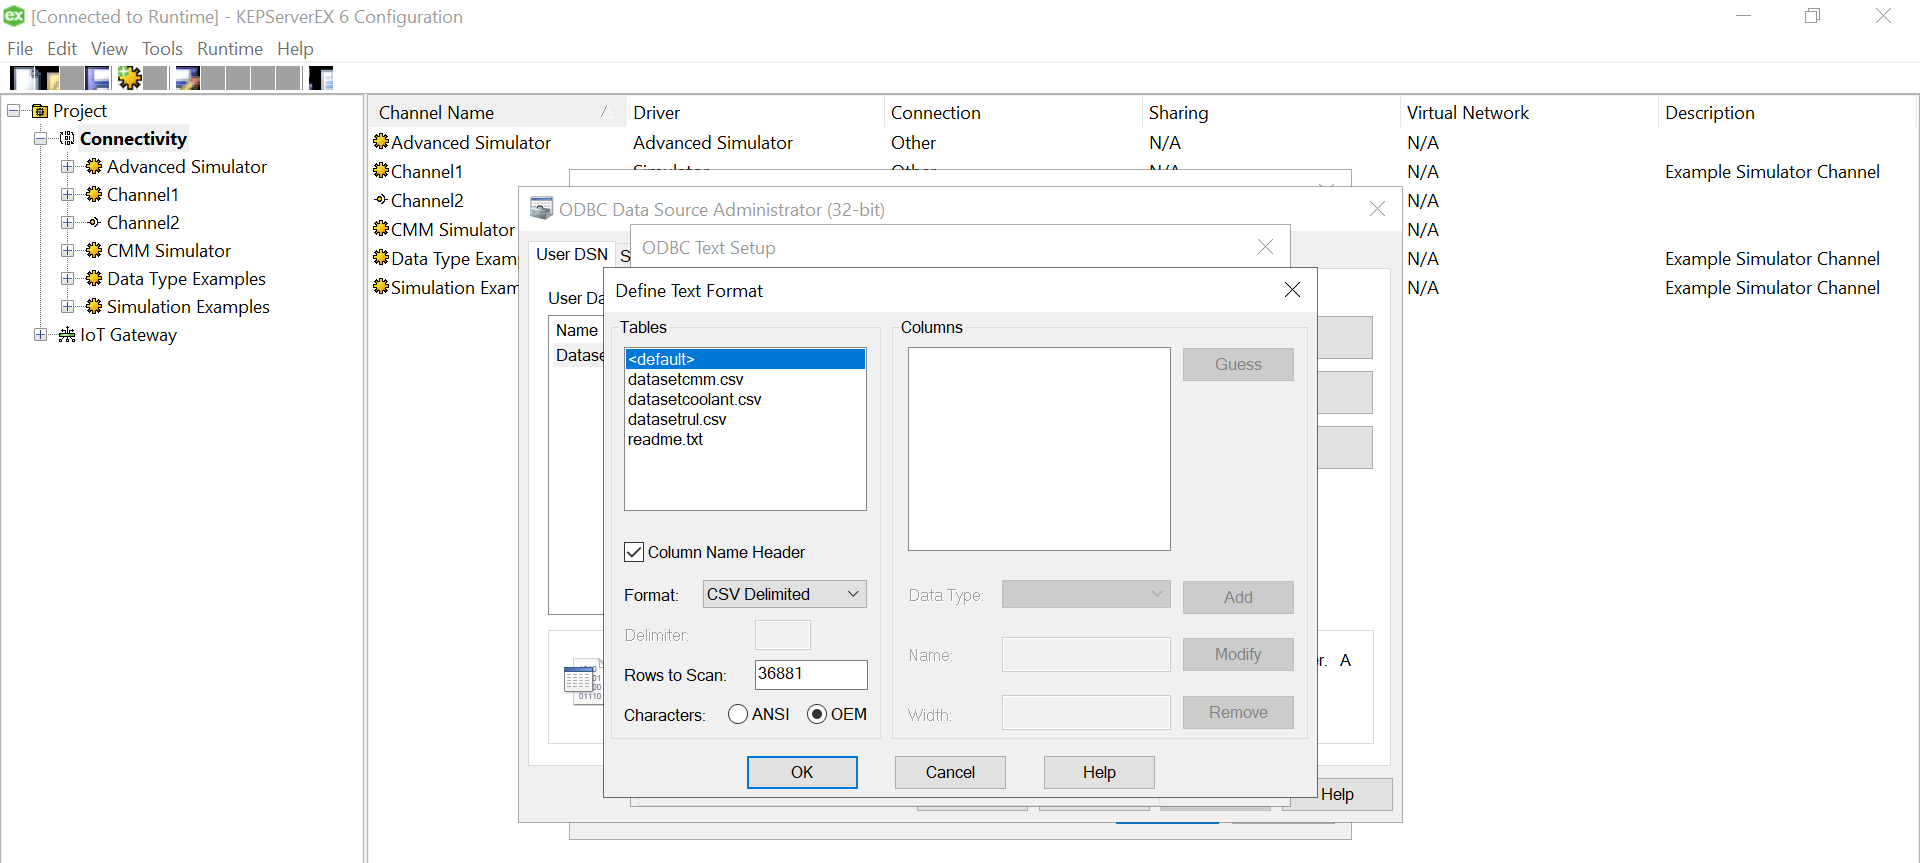
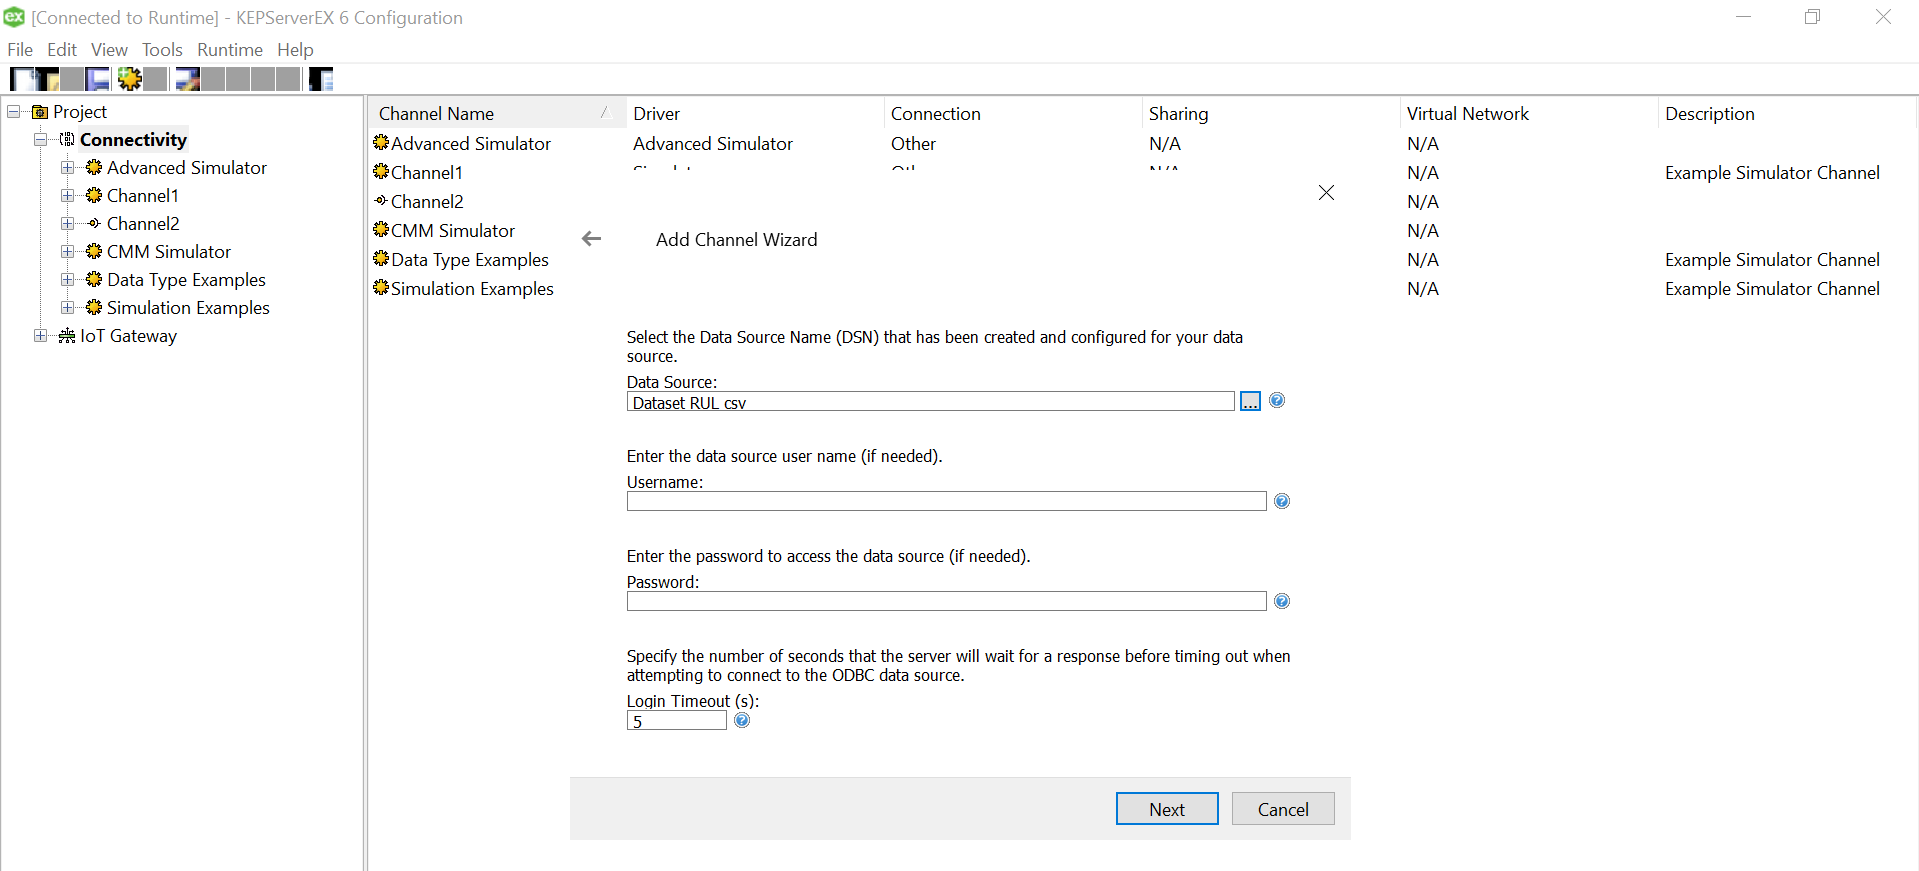
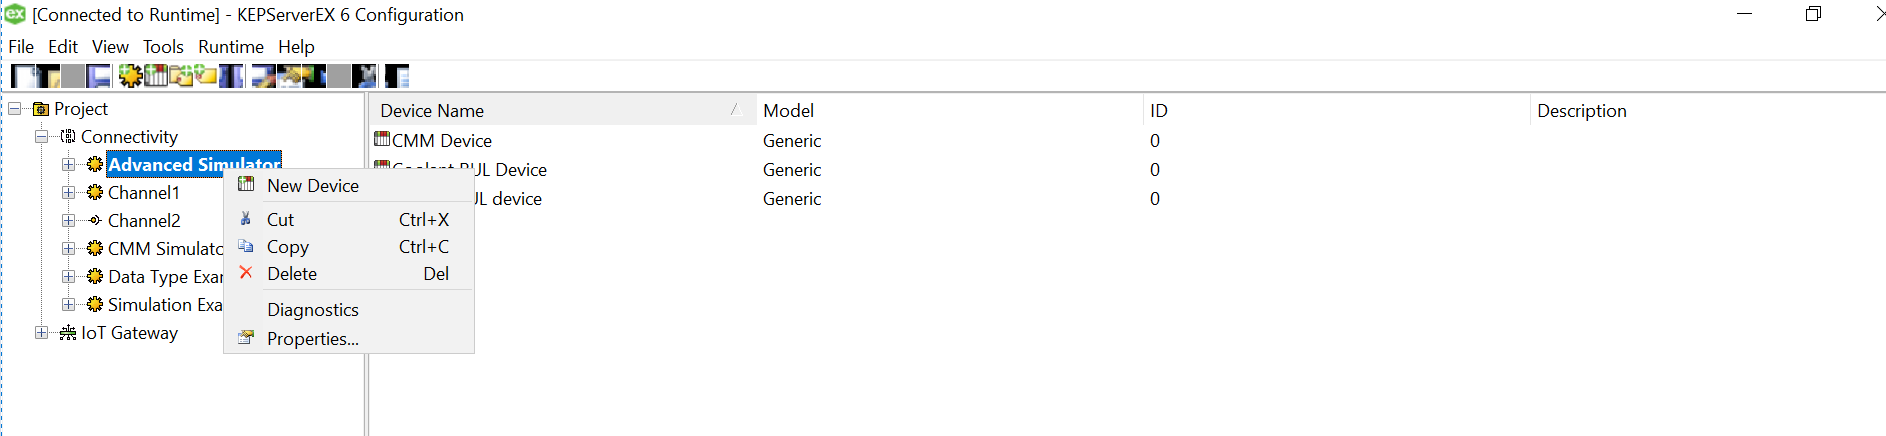
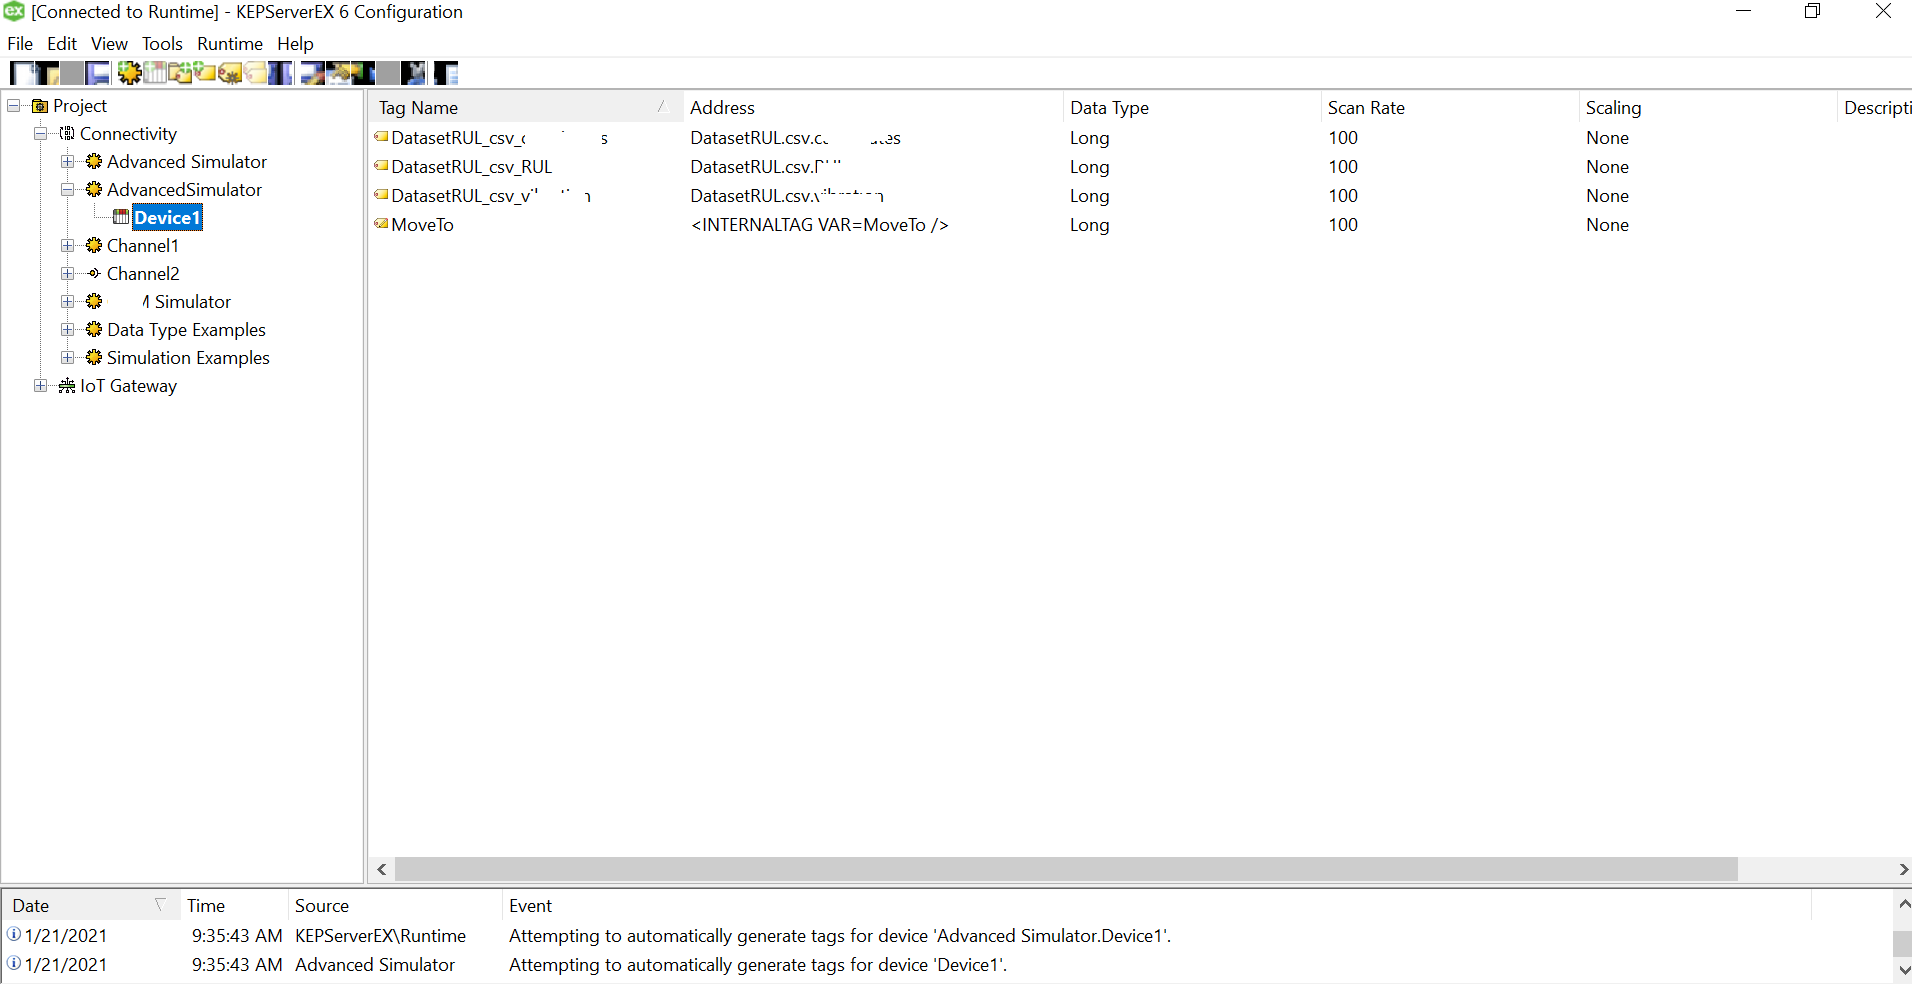
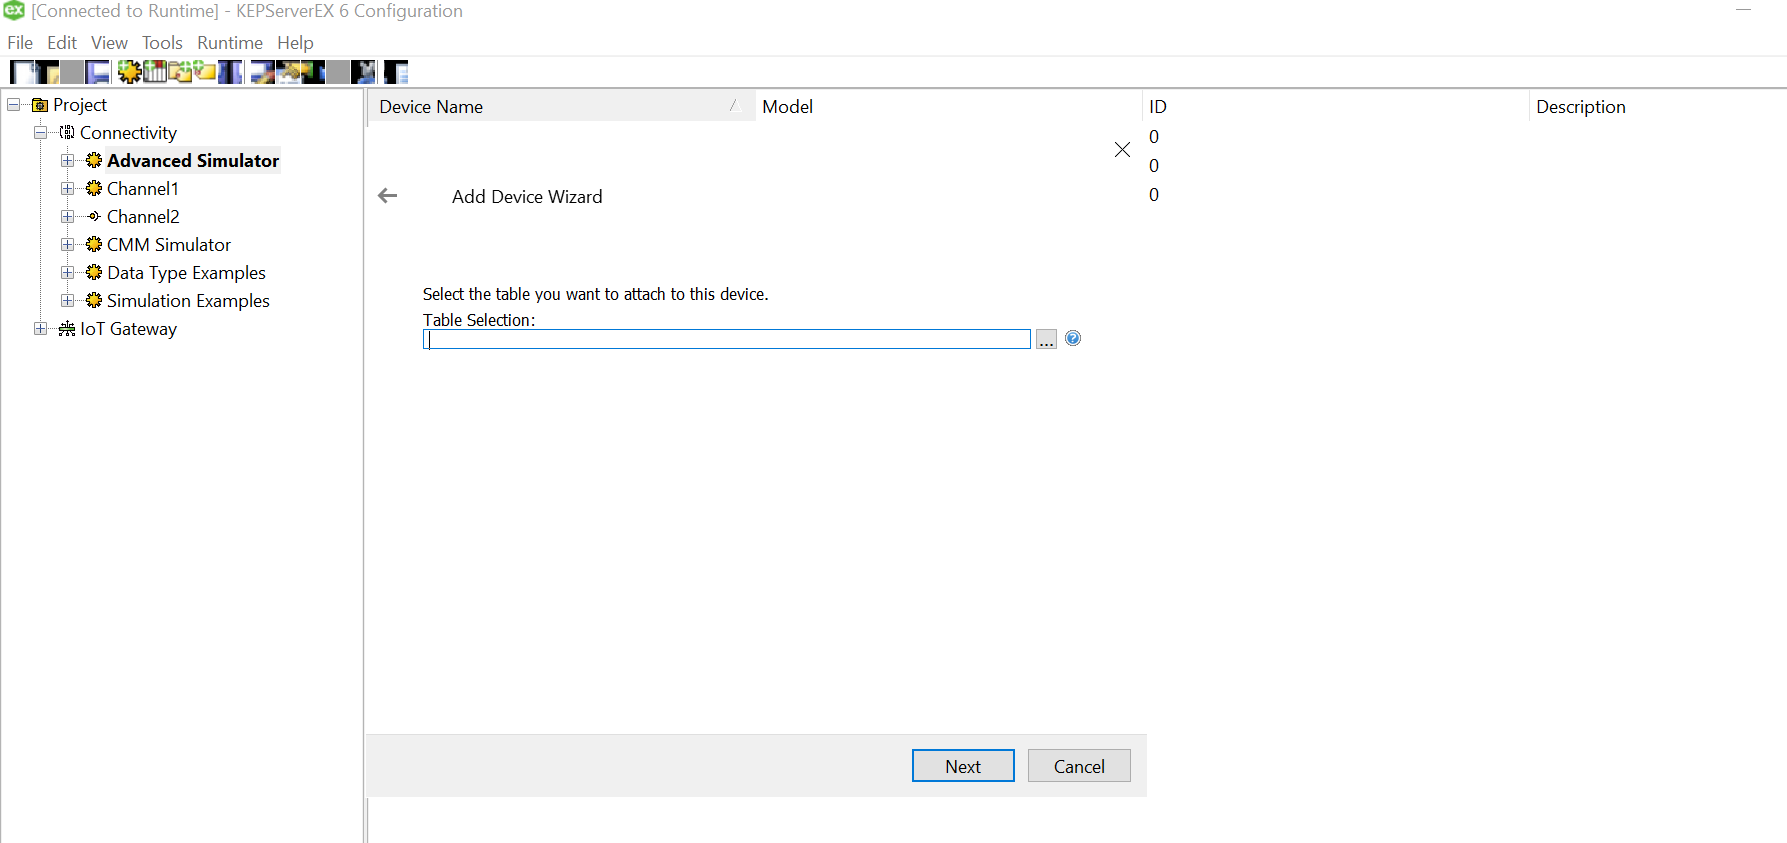
Click on the three dots and select the soecific csv for this device from the data source mapped earlier while setting up channel.

Specify the file read rate in the record selection interval. Please note that the time is milliseconds. Enable looping so that you get continuous stream of data once the cycle gets over. Please note that you need to repeat these steps for all the devices and its CSVs. but those devices timestamps may not be synchronized necessarily. it starts counting whenever it is setup and running.
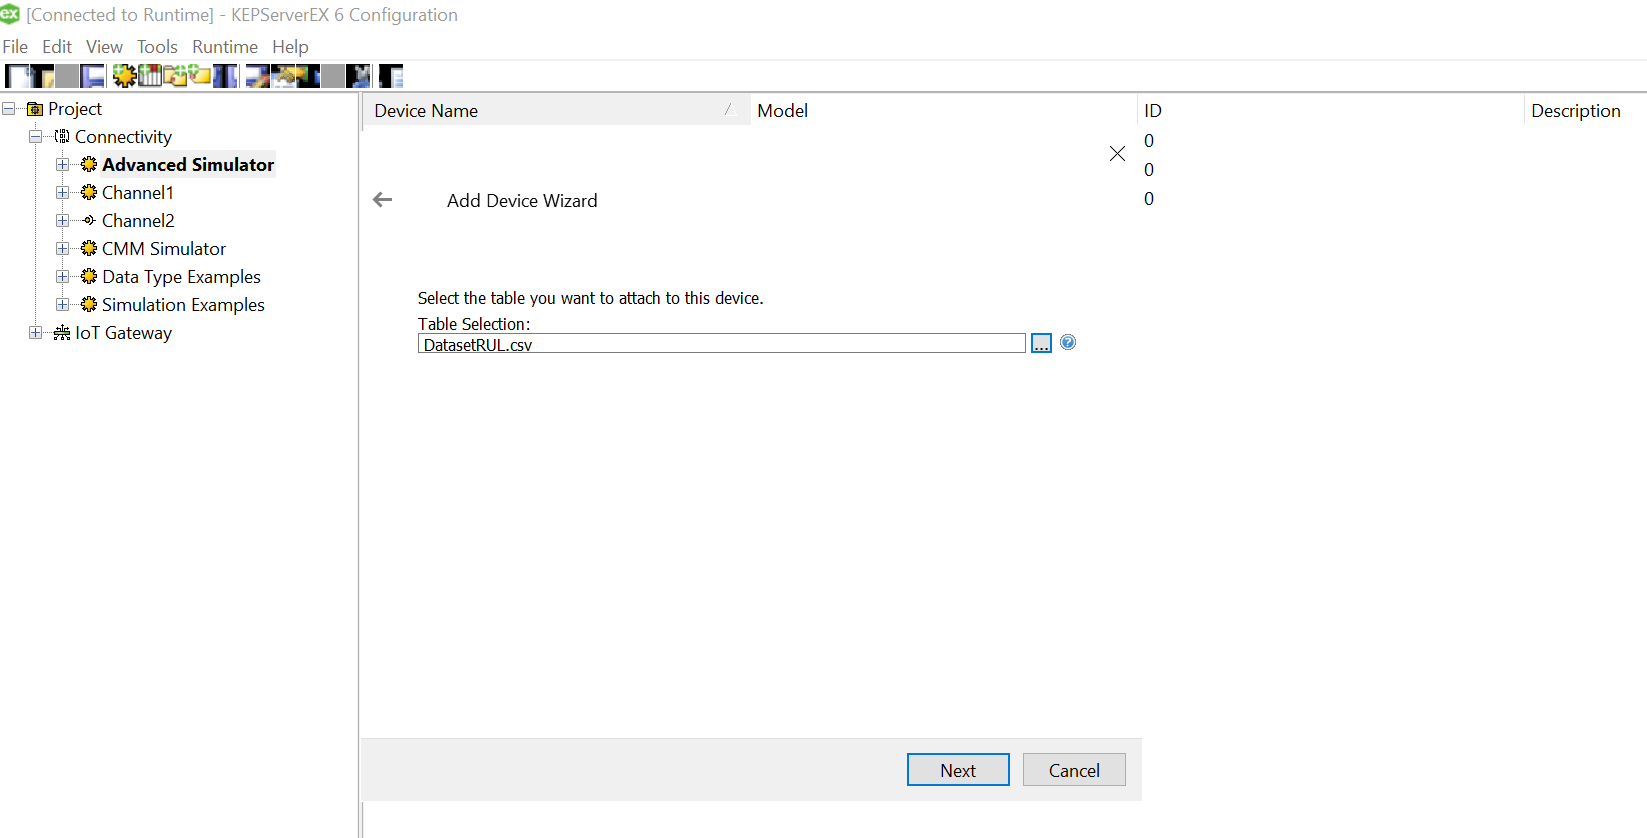
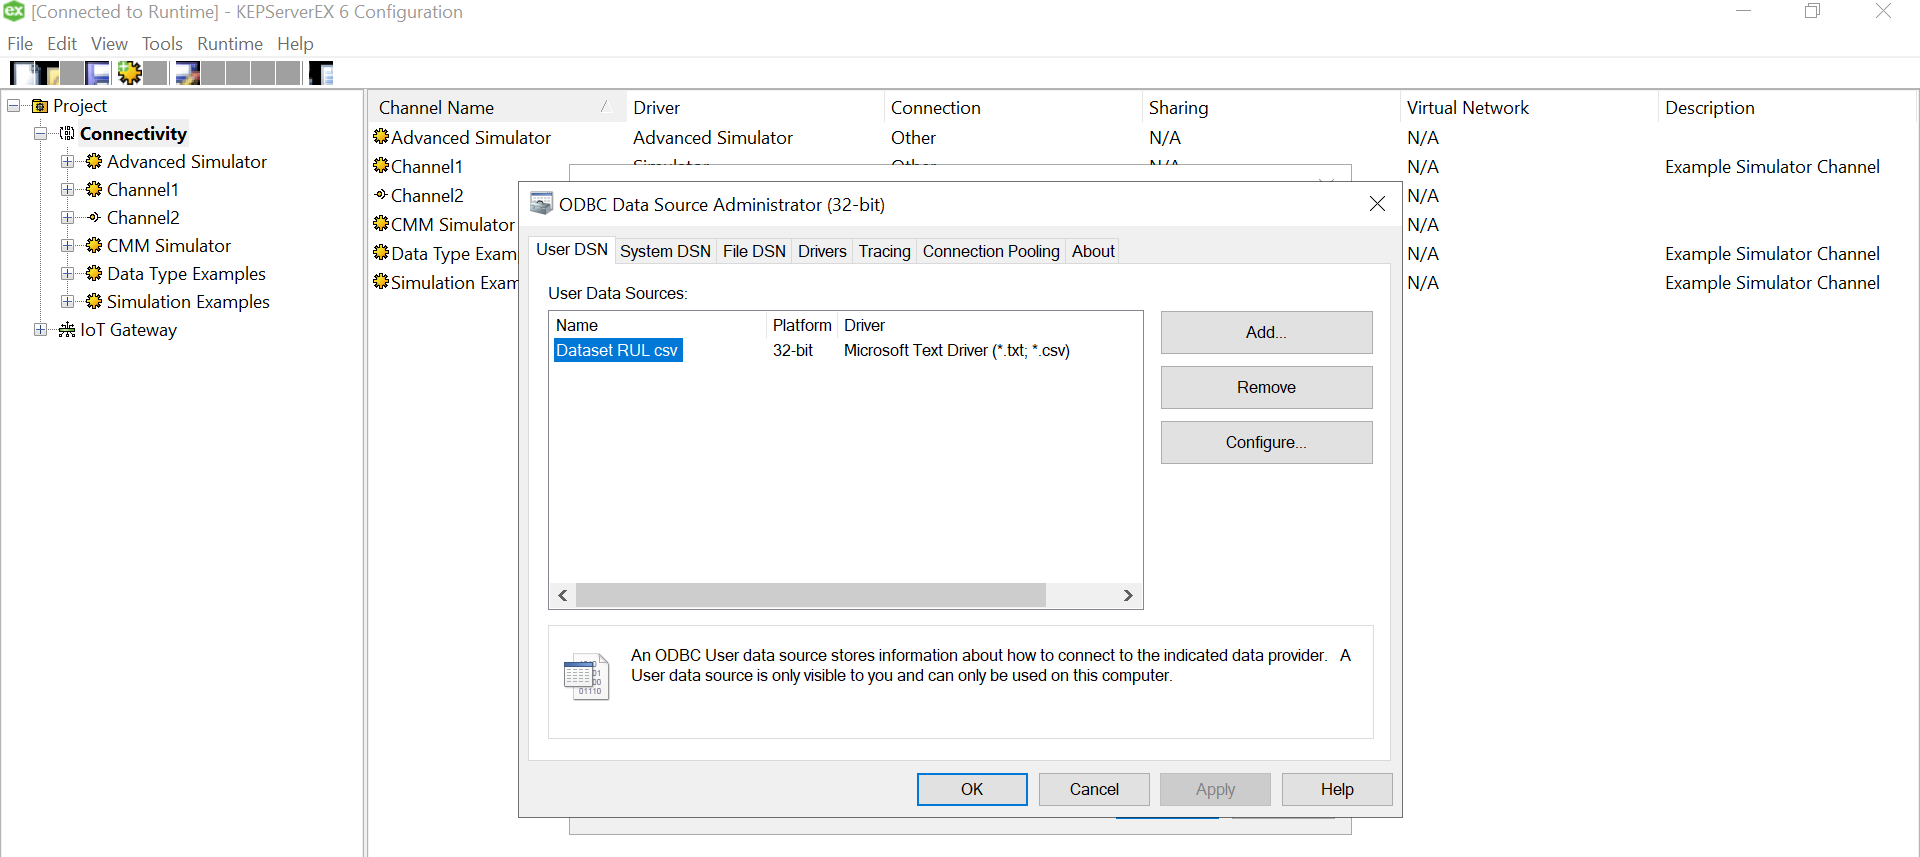
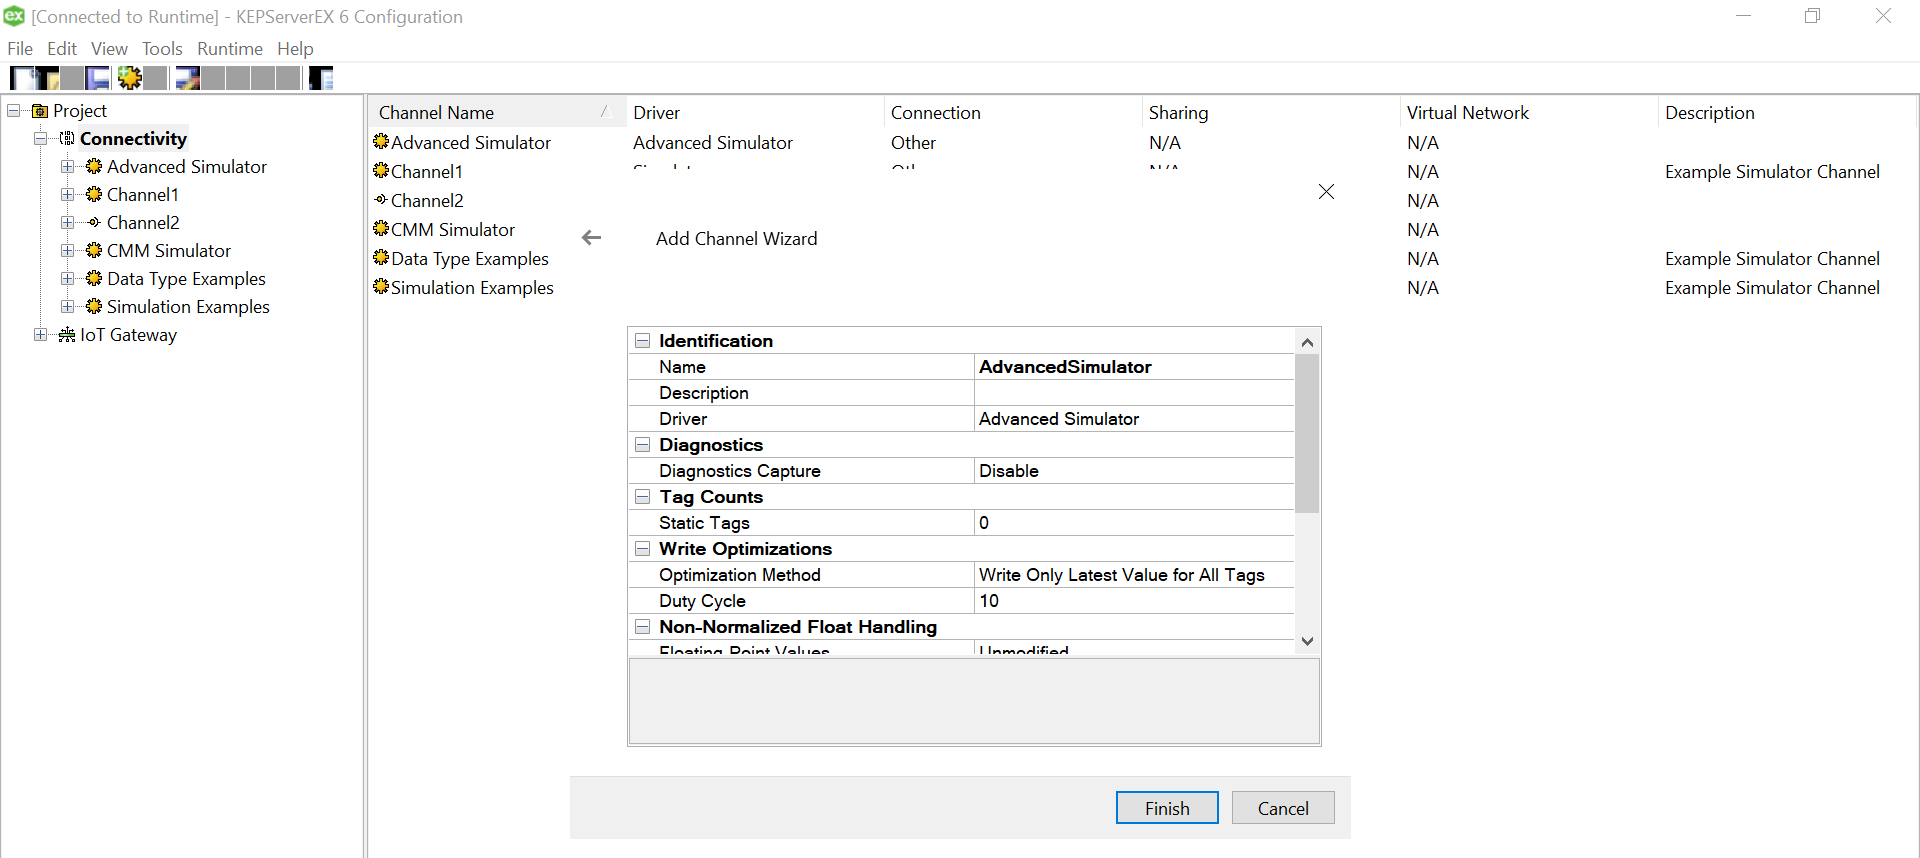
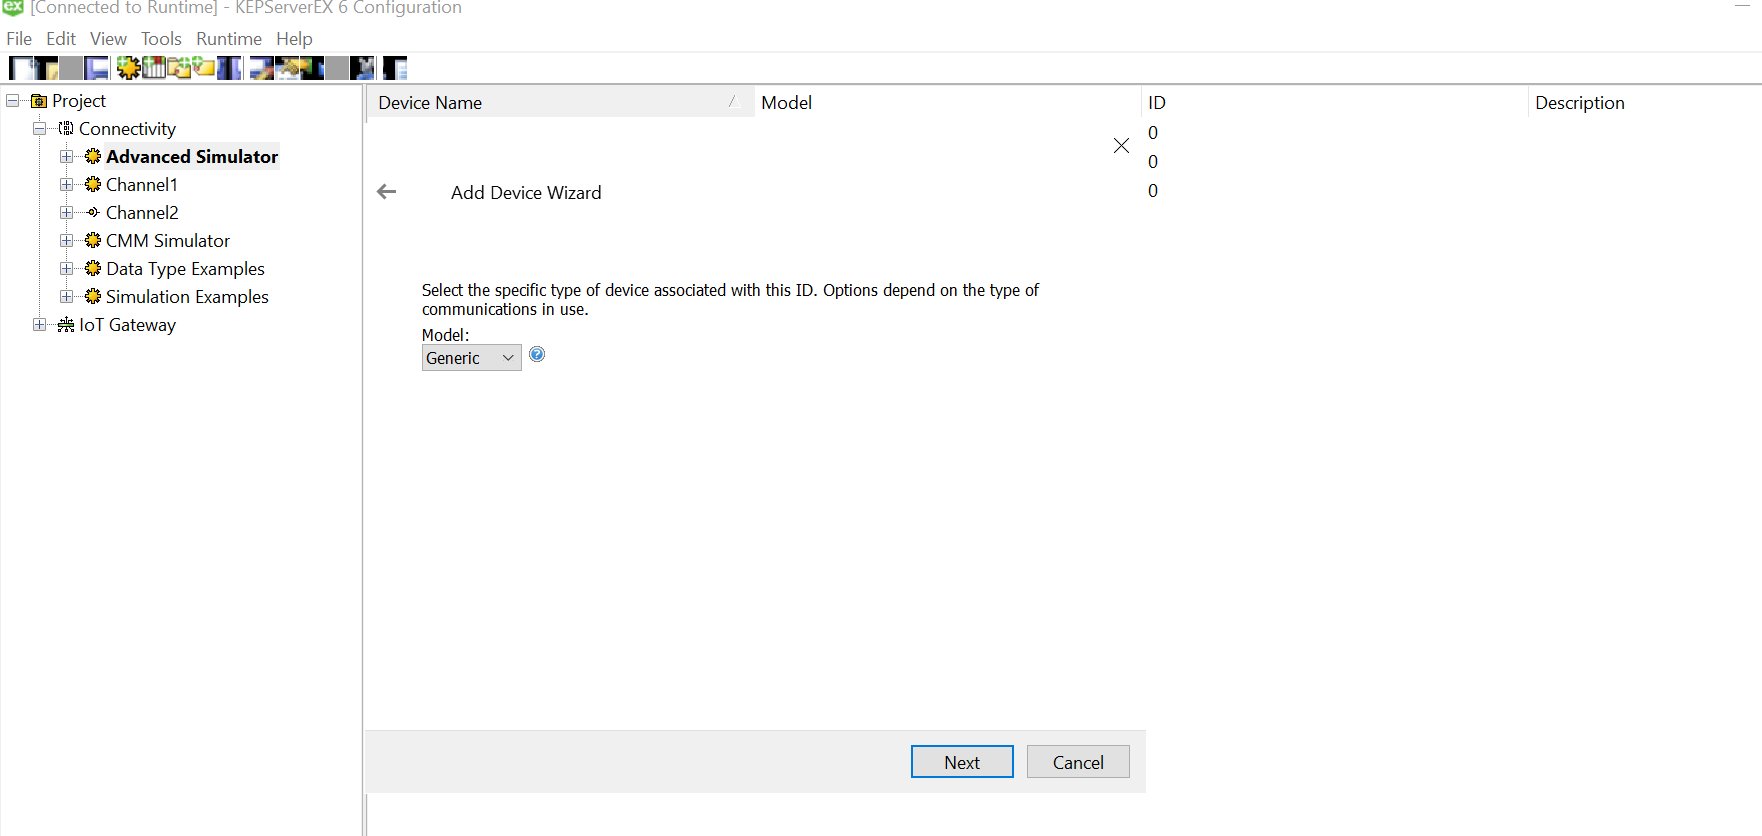
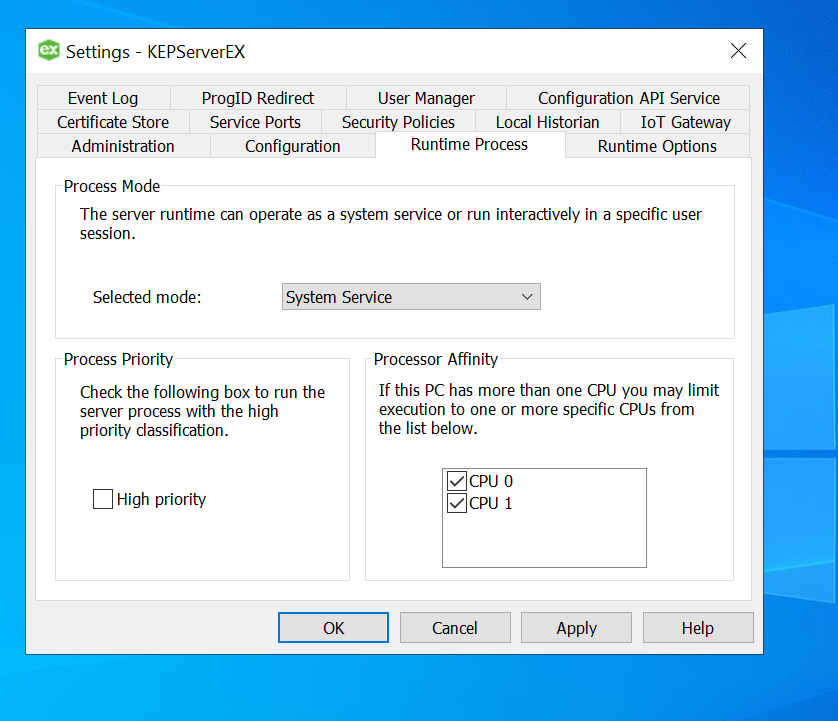
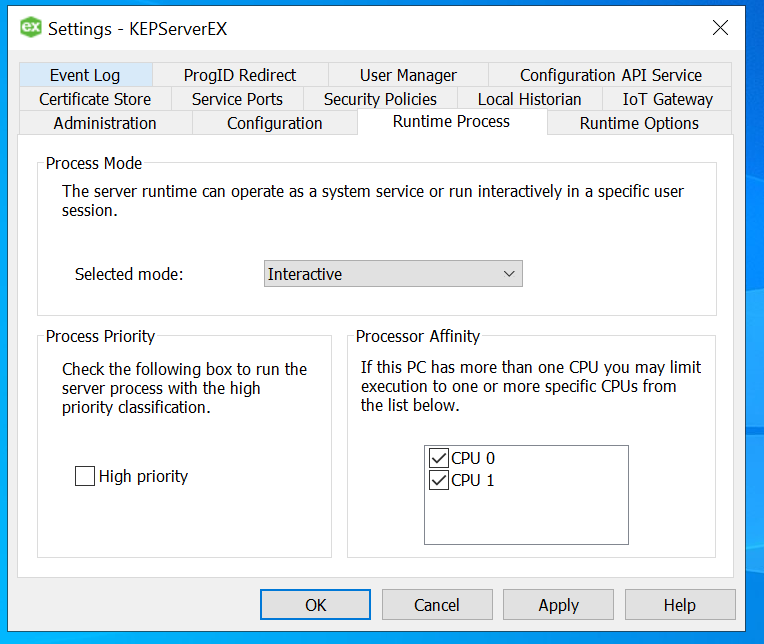
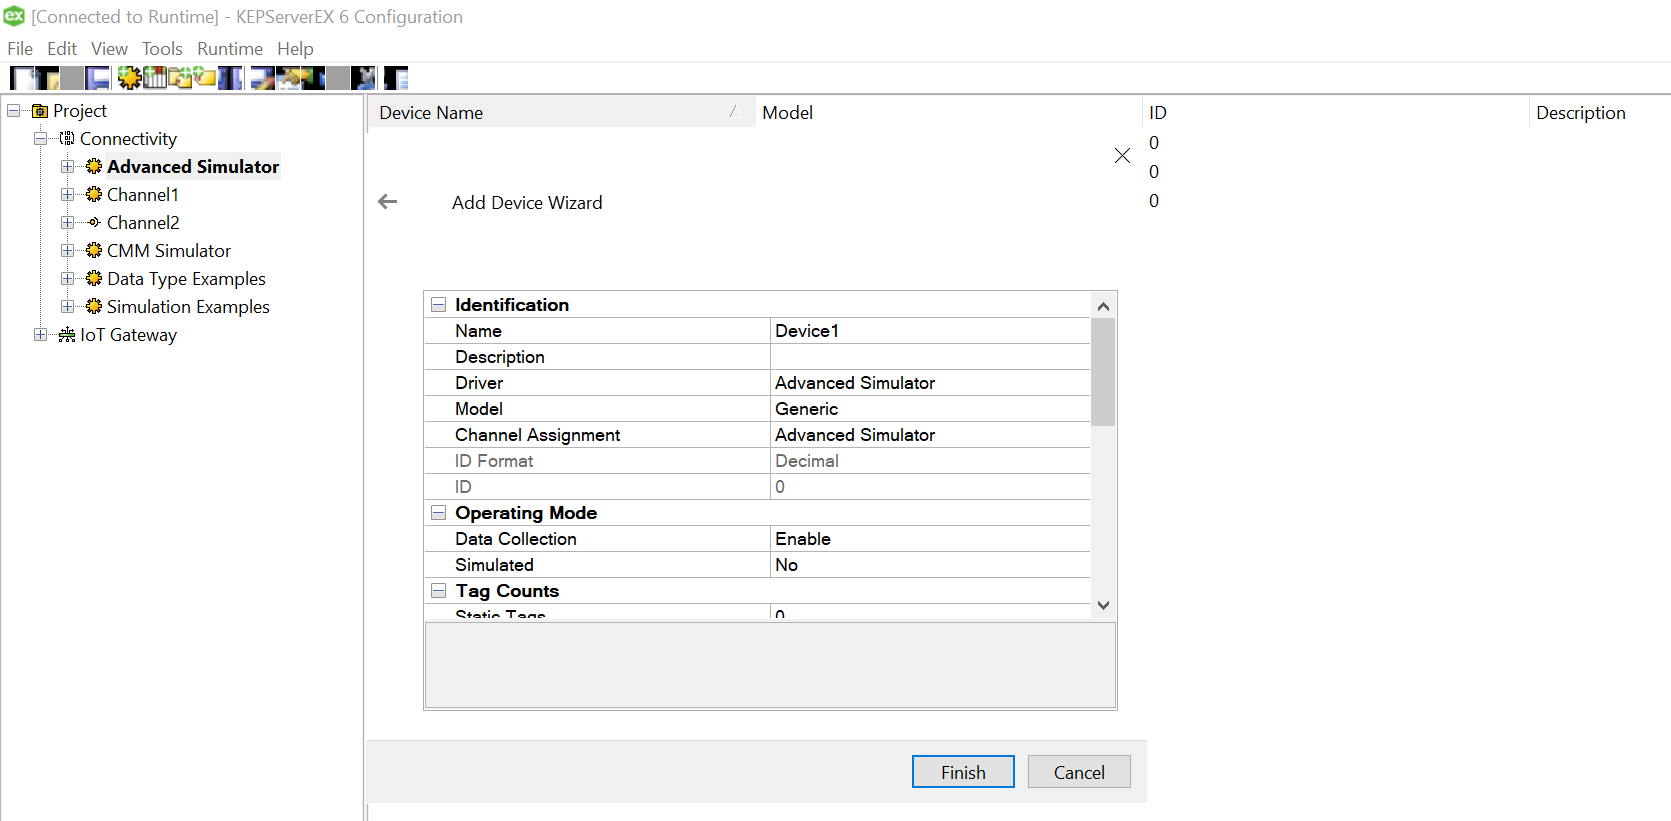
Click Finish and the device is successfully added, the driver should be able to “Generate” the TAG names from the column names. In case, the logs indicate an error as below, you may want to change OPC configuration settings to resolve it.

Ensure the user has administrator access on the Kepware so that he can access the kepware administration application as shown below. [It is accessible over the tray icon at the right bottom of the windows ]. Click on the “Settings” and Find and Navigate to the “Runtime Process” Tab. Change the selected mode to “Interactive”

Apply the settings and “Re-initialize” / Stop and Start the Kepware server instance.

The Tags should now be auto generated, and the simulator should be able to read the data from the files successfully.

This can now be pushed to either to the IoT Hub or Edge device to process it further!

Happy Simulations.. 🙂

The right pitch!

Having won a few high stake competitions in my company and elsewhere, I was planning to do an article on how I created most of those 10-15 mins pitches, with a ‘believable’ story telling to convey my ideas.

But before I could pen my thoughts, Scott Dadich, Editor in Chief of Wired, articulated it better than what I could have. He wrote in his editorial of Jun 2015, how he chose the cover story on Artificial Intelligence from a number of other pitches.

To rephrase what he said in 7 points regarding selling of an incredible idea in a time when ideas are plenty and execution debatable.

  1. Firstly, imagine you are writing a one page pitch, under 500 words, for your cover story to an editor in chief. You are selling your story and he has that tough task of selecting the best one among a deluge of good material from people like you. Now, how would you go about it?
  2. Establish quickly why you are a Subject Matter Expert and why you know your story well inside out.
  3. What is unique in the story as compared to similar ones read or heard earlier – USP!
  4. Is this the future? Case in point where we are seeing some adoption points.
  5. Like a short story – A conflict between the current popular narrative and thought process and the story in hand – This is where the idea has to be elaborated and told how it works out.
  6. If this clicks, what is the impact that we are looking at.
  7. Applies only if you are selling your idea to someone else for a spot in the final story telling – How will you present it and what more could be in store – time and condition permits?

Now the above points have been made extremely (field) agnostic, from a technology parlance, so that it can be applied to a cover story you are writing, a technology business pitch you are selling to an audience judging you (something like shark tank 😉 ) or you are part of the deal team selling a multi year outsourcing project to a company with many competitors in the bidding process.

Ultimately, in my opinion, story telling is vital to every single individual irrespective of the field of practice we are in.

Would love to hear whether this helps you out to make your next brilliant pitch!


~ Trilok R. ~


IoT Data Ingestion strategies (quickly pressed..)

Having worked on data ingestion part of IoT for 6 months with IoThub, what I have understood is that a few strategies should be applied while during data ingress to ensure smooth and meaningful data ingress.

  • Understanding the frequency of data ingress

If you look at the tiers given by Azure itself for data ingress Total Messages per day and each message packet size determine the one you choose among the 4 available. The more the messages, the more difficult it is to stuff everything into a database and then parse to make it meaningful. The ideal solution is to remove certain data which are off the chart or send it specific repositories. For example, if you want to remove data from event 1 processed and moved to datastore 1 and data from event 2 moved into datastore 2 at the outset itself.

  • Annotation metadata to data

Now that your IoT Device has collected billions of data and that you have stored it in some format, to build a relationship and history, would you search through the entire tables and build that hierarchy. I guess, you are better off adding metadata on the run

  • Stream Analytics is a must

If you want to raise an alarm when there is a temperature spike or fall, or if you want to start another process when the process 1 is continuously failing / not sending data, we would want a Stream analytics solution whomsoever provides in your ecosystem, be it Azure, Amazon, Google, IBM and the like. No one wants to build analytics and wait 10 mins for the instant alerts.


(Article in KDNuggets helped me verify that my understanding is in tune with what the industry and academia in general thinks about data ingress in general.)

HTTP Status Code confusions..

Recently, we were working with Microsoft BOT connector and a few other libraries on Microsoft Stack.

We were continuously getting 403 Forbidden returned from server.

Of the course, the naive person that I am, googled what all it could mean. Since, I had already given the right keys and access and it matched all the other code samples available on the internet for accessing the said image content from an URL from Slack, FB and skype, I had to check all the headers and the whether I have used the right ones.

After numerous hits and trials, we stumbled on a solution which told us, that Skype needed login and details, FB messenger and Slack needed Accept Header telling the Content Type for the respective Bot platforms to send image back.

More about this issue and how to handle in the next post on Bot messenger and sending images to your chat bot.

Going back to our case here, I was wondering why was it that all three messenger platforms were giving me confusing responses which had nothing to do with the issue causing it. After a few searches I ended up this blog piece – Choosing a HTTP Status Code.

It is extremely important that servers send the right error code and we act according to the expected error code.

In our case had we got either 406 or 415, we would have found out the issue much earlier!


The website gives the following reasons to use the right elaborated status codes.

  1. Clients already handle (or could easily be extended to handle) different codes with special behavior:

    • 301 Moved Permanently vs 302 Found has SEO implications with Google and others
    • 301 Moved Permanently is implicitly cacheable, while 429 Too Many Requests is implicitly not-cacheable, and so on
    • A client library could handle 429 Too Many Requests by backing off and retrying the request after a delay
    • A client library could handle 503 Service Unavilable similarly
  2. Even though not exhaustive for modern requirements, many status codes represent cases still worth handling with a special response (so why not use the standard code?)

    • APIs that return 404 in place of 405 Method Not Allowed drive me crazy wondering, “did I just fat-finger the URL or am I sending the wrong HTTP method?”
    • I can tell you we would have saved hours upon hours of debugging time if only we had distinguished 502 Bad Gateway (an upstream problem) instead of confusing it with 500 Internal Server Error
  3. Believe it or not, a convention is being established among widely used APIs to return status codes like 201 Created, 429 Too Many Requests, and 503 Service Unavilable. If you follow that convention, users will find it that much easier to use your website/API and troubleshoot any issues they may run into.

XHackers Meetup | Xamarin Evolve 2014 Recap

Saturday the 8th of November, 2014.

Hamilton Hall in Microsoft Signature building was half occupied by the time Kirti and I walked in to the room. Nish was already there and setting things up. We understand Bangalore, rains, traffic and the general laziness in the general scheme of things. We quickly started off with a round of introduction. By then the rest of the folks came in including the late XHackers core team 😉

With the introduction behind us we realised that we had people from varying levels of Xamarin understanding.

  • Amateurs & Rookies : Professionals from mobile and desktop application & students
  • Semi-pro : Mainly professional who have tried out Xamarin and are aware of the basic building blocks
  • Pro – Developers from industry who had already mastered Xamarin were here only for the recent announcements and demos.

IMG_1222IMG_1150

Therefore, we attempted to have content to the likes of each group in the audience. Nish started off with the basics and a proverbial hello world of Xamarin to get the audience to the same level and let them know what all the excitement was all about.

Next act was mine.

I gave them an insight into the story behind XHackers, the journey so far. We breezed through all the the meetups so far and its agenda right from our first one @HSR Layout, Bangalore. Detailed them about the expanding chapters of XHackers. Last but not the least introduced the current core members of XHackers. You can find the presentation here. One person stopped me to detail about XHackers name and logo’s design philosophy. I would like to take this opportunity to thank a friend of XHackers – Reeko Johny for this amazing support to create this exciting and fresh logo. It has design philosophy from three major ecosystems Apple, Google and Microsoft in fonts, colours and overall design. X stands for both cross-platform and Xamarin. Hackers are those bunch of people who go one step beyond their normal routine coding tasks to explore the new realms of software development! Find the presentation here.

With that Nish continued with his presentation on Xamarin and announcements.

IMG_1174

He spoke about Xamarin capabilities and code share ability. He spoke about Xamarin Forms, Xamarin Android Player, Sketches, Profiler, Insights, following it up with demonstration of these new features. He also spoke about the partnerships and components availability that Nat spoke about during Evolve. You can find the presentation here.

IMG_1256

Vidyasagar upped the ante with an exciting sneak peek into gaming with CocosSharp. He showed us folks how easy is to do start doing some basic game programming and answered to the cheeky questions from audience. His perspective and blog on the same could be found here.

IMG_1285        
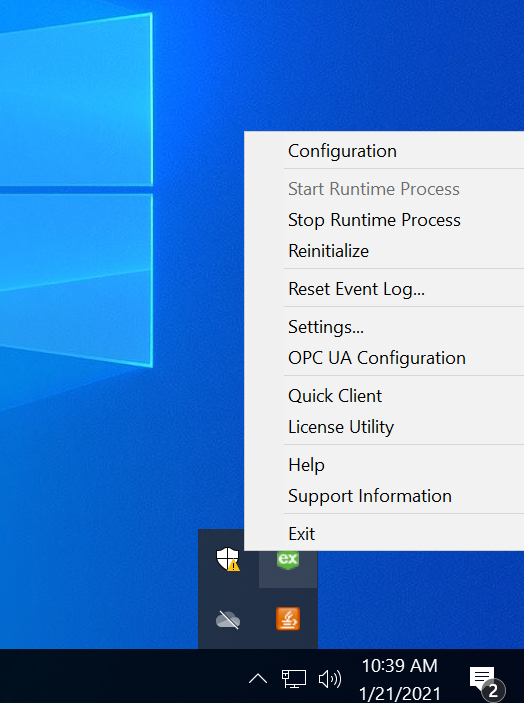
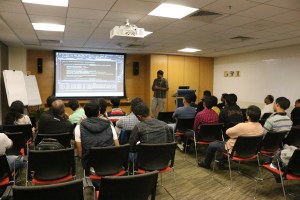
Lohith followed that up with a session on Telerik and their amazing Xamarin Forms controls for new wave of cross-platform applications. He showed some interesting demonstrations of the many controls that they have custom-made for Xamarin Forms. This session was especially handy for the folks from enterprise who were there for this session. They had specific questions on how it could be leveraged for their existing applications and Lohith answered to them happily. More information can be found here.

Chaitra coming fresh from her TechEd talk on connected devices, continued with the same passion to talk about the future of connected devices and how Xamarin would help us write for the world of connected devices with applications for multiple devices at the same, including the amazing Android based Moto 360. Nish was wearing that watch with the service running in fact. 🙂 She also spoke about code shareability and other details based on her enterprise experience working with advanced enterprise Xamarin applications and application scenarios.

IMG_1337

Anubhav and I closed the session with some Q & A and goodie fest. T-Shirts and monkeys were given to the avid tweeter in the audience (Prabhu Jackson) and a few other folks with insightful questions. We shared the documentation about Xamarin and ways to order Xamarin T-Shirts.

On closure, we also launched a CONTEST. The best blog about the event will stand a chance to win a Xamarin Forms book!!! Write a blog, publicise and let us know about it. Come back for the next event and if we find that yours is the best, the book is yours for keeps.

If there is one thing we all agreed at the end of the session, it is simple. It is an exciting time to be working with Xamarin and making applications. So enjoy the ride!

I sincerely, hope this blog inspires you folks to write about the event and win the amazing gift.

Special thanks to Core members:

IMG_1240IMG_1220IMG_1290

Nish, Prasant, Mayur, Anubhav, Kirti, Chaitra, Pooran, Murugan, Vic, Lohith, Vidyasagar for making this event successful.

and of course, our friends @Microsoft.

Signing off for now..

~Trilok~

Upcoming Event Alert: Xamarin Evolve 2014 Updates Meetup

"Evolve"d Monkey
“Evolve”d Monkey

Folks,

Hope you all have been feverishly coding using Xamarin. We love Xamarin for the freedom and flexibility of using C# to develop our applications on both iOS and Android in addition to Microsoft platform. To say the least, the journey so far has been exciting. we developed in each platform separately sharing same core and writing native UI. Then we used various plugins to explore MVVM patterns like MVVMCross on top of Xamarin. Then came Xamarin Forms of course which made life all the more easy and straight forward.

It gets all the more interesting and fast paced here on especially with the latest announcements made at Xamarin Evolve 2014.

Wait?  What – You missed it?!!?

OK. Chill…

Don’t worry! This weekend, on Saturday, the 8th of November, 2014 we are doing a recap and a hands on introduction to the new features announced at Evolve this year. To give you a heads up, Evolve announced many new things.

Of course, Xamarin IDE updates, Xamarin running on smart watches, Xamarin on latest iOS, Profilers and sketches, Xamarin Android player, Xamarin Test Cloud, Xamarin Insights, Xamarin.Robotics in Beta and what not.

Too much information? Interesting?

Wait till you see them in action 🙂

This Saturday, hear about all these exciting features from Xamarin Evangelists and Xamarin Enthusiasts – XHackers at Microsoft campus.

Click here to show your interest and register for this meetup. Of course, limited goodies are there for in event participation and contests 😉

See you there.

Trilok…